Figure 1.
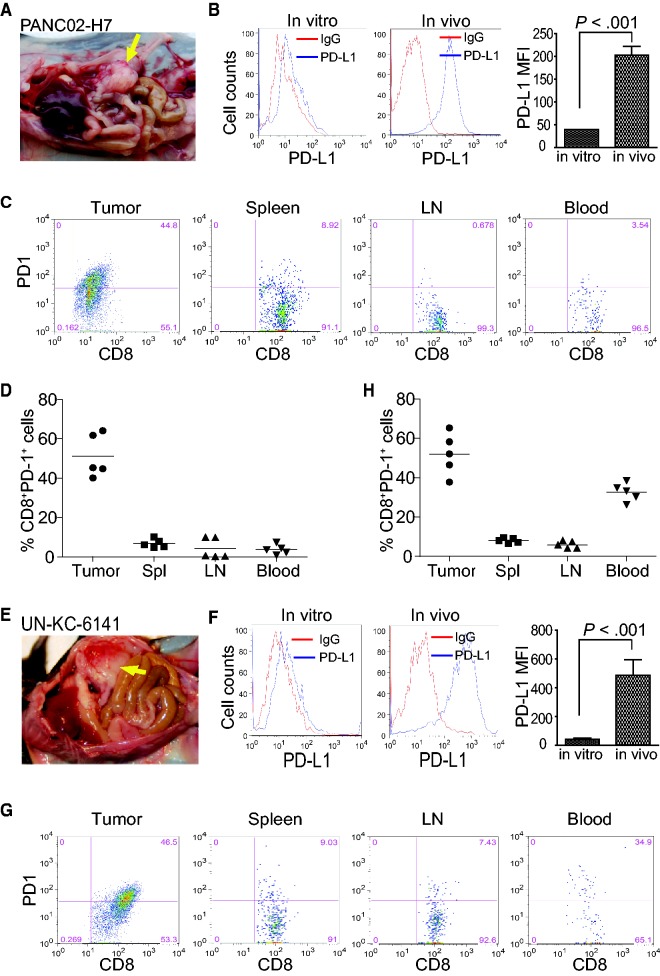
PD-L1 and PD-1 expression profiles in pancreatic cancer in vivo. A) PANC02-H7 cells were surgically transplanted to pancreas of C57BL/6 mice to establish orthotopic pancreatic tumor (yellow arrow). B) PD-L1 expression level on cultured pancreatic cancer cells (in vitro) and the tumor (in vivo) as shown in (A). The PD-L1 protein level (mean fluorescent intensity [MFI]) was analyzed by two-sided t test and presented at the right. Column: mean; bar: SD. C) Cell suspensions were prepared from pancreatic tumor tissues, spleen, LN, and peripheral blood from five tumor-bearing mice (n = 5) and stained with 7-AAD, CD8-, and PD-1-specific antibodies. Stained cells were analyzed by flow cytometry. D) Quantification of CD8+PD-1+ CTLs in the indicated tissues. 7-AAD+ dead cells were gated out. CD8+ cells were gated and analyzed for PD-1+ cells. E) UN-KC-6141 cells were surgically transplanted to the pancreas of C57BL/6 mice to establish orthotopic pancreatic tumor (yellow arrow). F) PD-L1 expression levels in cultured UN-KC-6141 cells (in vitro) and orthotopic UN-KC-6141 tumor (in vivo). The PD-L1 protein level (MFI) was analyzed by two-sided t test and presented at the right. Column: mean; bar: SD. G) Analysis of CD8+PD-1+ cells in the UN-KC-6141 tumor model in the indicated tissues. H) Quantification of CD8+PD-1+ CTLs in the indicated tissues. 7-AAD = 7-aminoactinomycin D; LN = lymph node; MFI = mean fluorescent intensity.

