Figure 3.
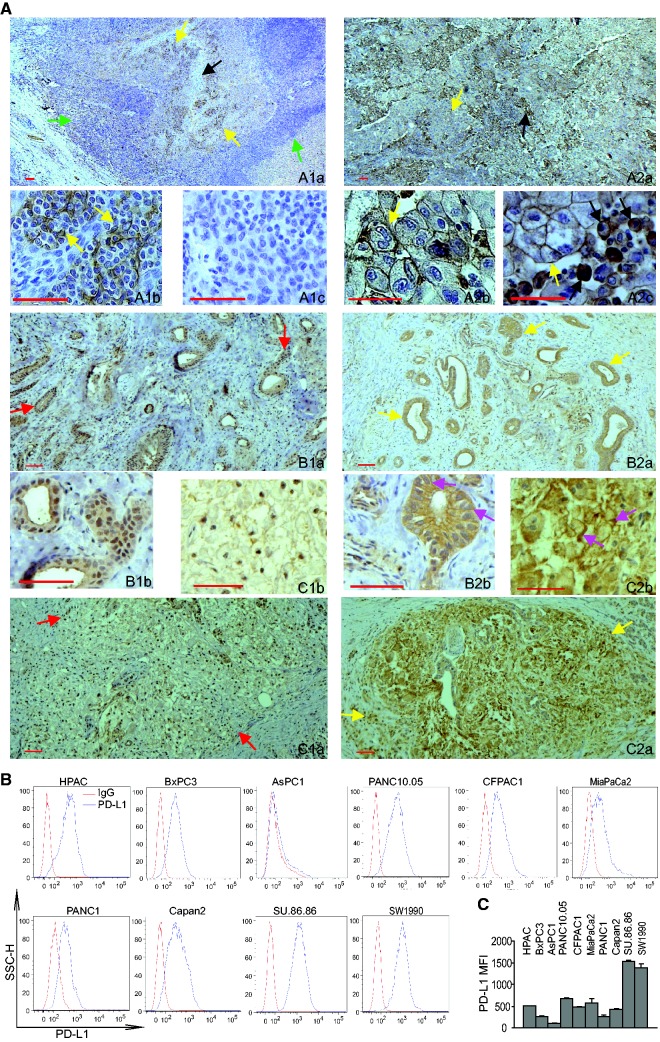
MLL1 and PD-L1 protein levels in human pancreatic carcinoma cells. A) Immunohistochemical staining of human tissues. A1a and b) Human tonsil tissues were stained with anti-PD-L1 antibody. Shown are low (A1a) and high magnification (A1b) images of the stained tonsil tissue. A1a) The yellow arrows indicate PD-L1+ cells, the black arrow points to crypts, and green arrows point to lymphoid cells. A1b) The yellow arrows indicate PD-L1+ epithelial cells surrounding the crypt. A1c) Negative staining without anti-PD-L1 antibody. A2a–c) Human adrenal tumor tissues were stained with anti-human PD-L1 antibody. Shown are low (A2a) and high magnification (A2b and c) images of the stained adrenal tumor tissue. A2a) The yellow arrow indicates tumor cells, and the black arrow indicates tumor cells and leukocytes aggregate area. A2b) The yellow arrow indicates PD-L1+ tumor cells. A2c) The yellow arrow indicates PD-L1+ tumor cells, and the black arrows point to PD-L1+ monocytes. B1a and b and C1a and b) Two human pancreatic adenocarcinoma specimens were stained with anti-MLL1 antibody. Shown are low (B1a and C1a) and high magnification (B1b and C1b) images of the stained tumor tissues. Red arrows indicate MLL1+ tumor cells. B2a and b and C2a and b) The two human pancreatic adenocarcinoma specimens as shown in (B1 and C1) were stained with anti-PD-L1 antibody. Shown are low (B2a and C2a) and high magnification (B2b and C2b) images of the stained tumor tissues. Yellow arrows indicate PD-L1+ tumor cells. Pink arrows in (B2b and C2b) indicate PD-L1 protein staining in both cell membrane and cytoplasm. MLL1- and PD-L1-specific staining is indicated by brown color, and nuclei were counterstained with hematoxylin in blue. B) Ten human pancreatic cancer cell lines were stained with IgG isotype control and PD-L1-specific monoclonal antibody, respectively, and analyzed for PD-L1 protein level by flow cytometry. C) Quantification of PD-L1 protein levels on human pancreatic cancer cell surface. The mean fluorescent intensity of PD-L1 protein as analyzed in (B) were quantified and presented. Column: mean; bar: SD. Scale bar (redline at the bottom left) = 50 μm.

