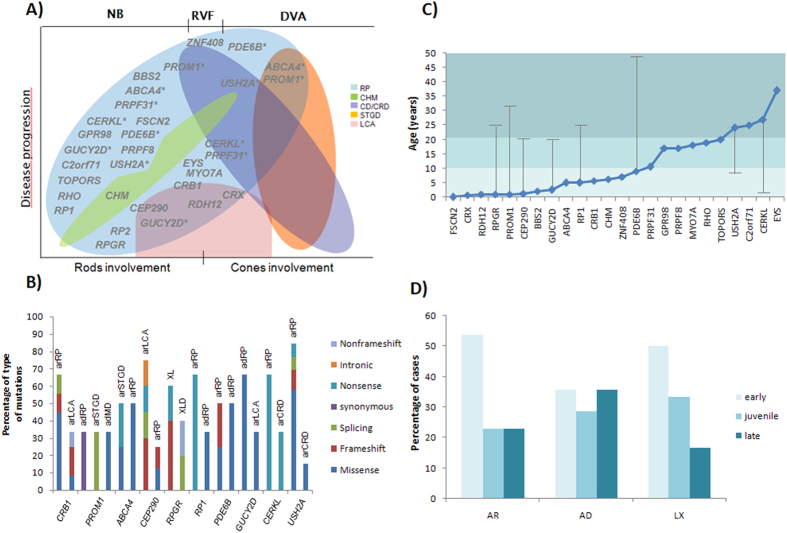
Figure 2. Genotype-phenotype correlations.
(A) Overlapping phenotypes among different forms of non syndromic IRD: RP (Retinitis Pigmentosa), CHM (Choroideremia), CD/CRD (Cone dystrophy/Cone-rod dystrophy), STGD (Stargardt disease) and LCA (Leber congenital amaurosis). Gene positions show the associated phenotype/s and the first reported symptom of cases in which they are involved (NB: Night blindness; RVF: Reduced visual field; DVA: Decreased visual acuity). Asterisks indicate genes represented more than once in the figure due to the high heterogeneity. (B) Distribution of types of mutations behind the different phenotypes caused by the same gene. (C) Mean age of onset of each of the identified genes. Vertical lines show the age of onset of cases not included in the average to be considerably different from the rest. Of note, the gene RHO was identified in only two cases with very different clinical features hence the calculated average may not be representative. Moreover, this representation do not include clinical and genetic data of family #65 since the large deletion affects several genes and it is not possible to determine the involvement of each of them. Light blue marks early-onset cases while a juvenile onset is stated with medium blue and a late-onset with dark blue. (D) Distribution of early-, juvenile- and late-onset IRD for the different modes of inheritance.

