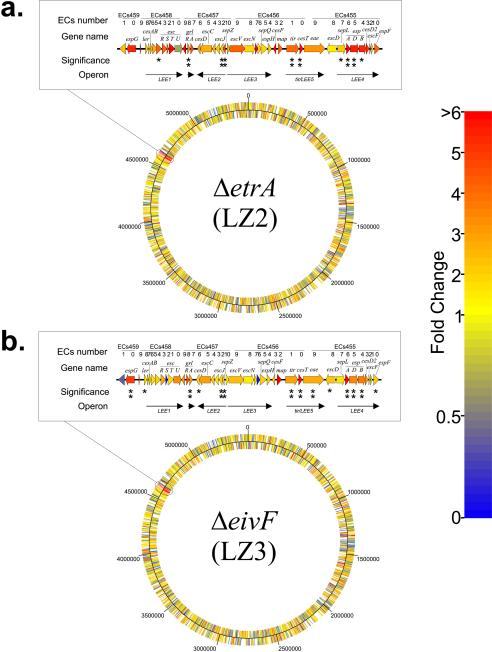
FIG. 5.
Up-regulation of LEE gene expression in ETT2 regulator mutants assayed by using microarrays: heat map of normalized microarray data showing changes relative to the parent strain for ΔetrA mutant LZ2 (a) and ΔeivF mutant LZ3 (b), colored on the basis of the fold changes. The circles represent the E. coli O157:H7 Sakai chromosome. The cutaway shows a magnification of the heat map for the LEE region. Asterisks in the LEE indicate the P values of the fold changes; one asterisk indicates that the P is <0.1, and two asterisks indicate that the P value is <0.05.

