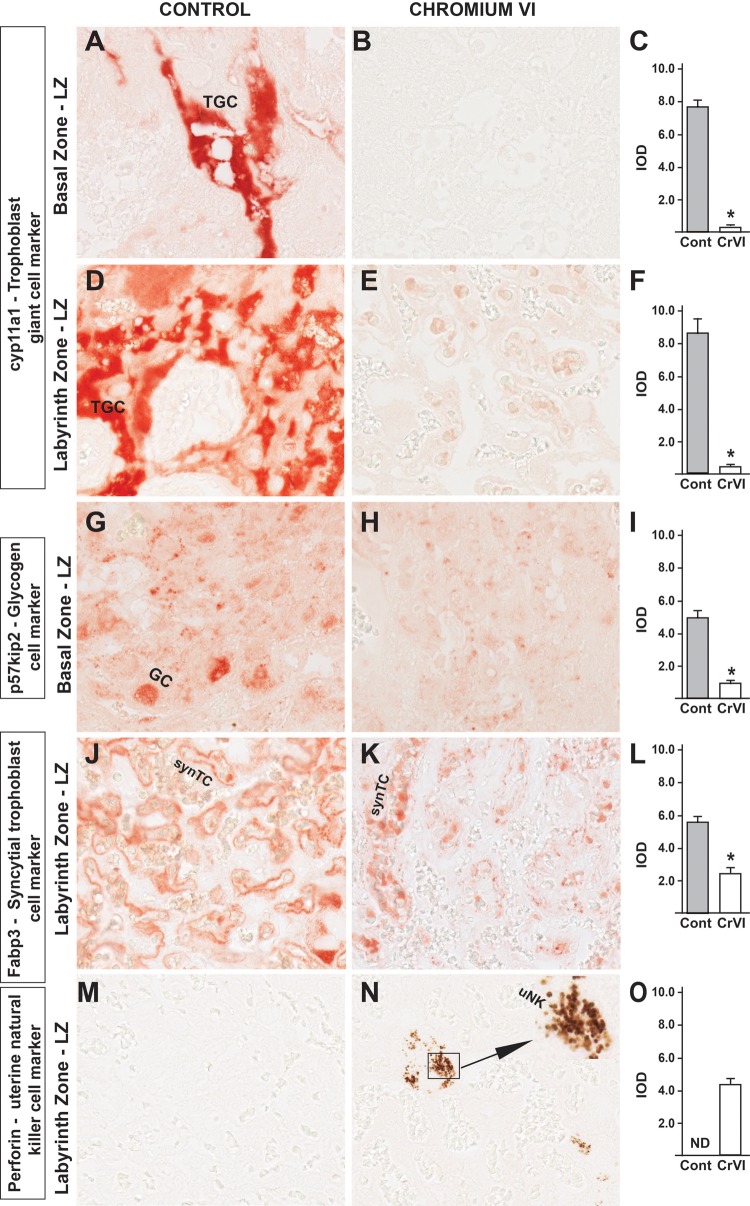
FIG. 3.
Effect of CrVI on the expression of TC differentiation markers of various placental compartments on 18.5 dpc. Pregnant mothers (n = 5) received drinking water with or without CrVI (50 ppm) from 9.5 to 14.5 dpc. Placentas were separated on 18.5 dpc and processed for IHC. Representative images are shown for the expression of the following markers: cyp11a1, TGC marker in the BZ (A, Control; B, CrVI; and C, histogram) and LZ (D, Control; E, CrVI; and F, histogram); p57kip2, GC marker in the LZ (G, Control; H, CrVI; and I, histogram); Fabp3, syncytial trophoblast marker in the LZ (J, Control; K, CrVI; and L, histogram); Perforin, uNK cell marker in the LZ (M, Control; N, CrVI; and O, histogram). The inset (N) shows an enlarged view of the infiltration of uNK cells in the synTCs of the LZ. TGC, trophoblastic giant cells; GC, glycogen cells; synTC, syncytial trophoblast; uNK, uterine natural killer cells; BZ, basal zone; LZ, labyrinth zone; dpc, days postcoitum. Each value represents mean ± SEM of 5 placentas. *Control versus CrVI, P < .05. Width of field for each image is 220 μm.

