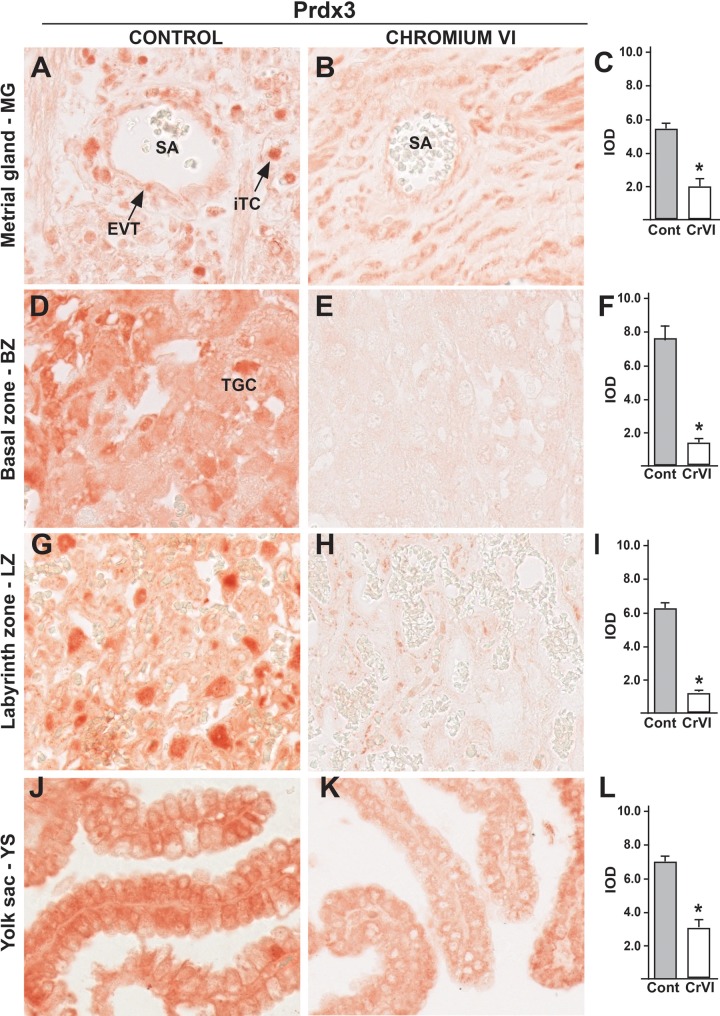
FIG. 9.
Effect of CrVI on the expression of Prdx3 on 18.5 dpc in the placenta. Pregnant mothers (n = 5) received drinking water with or without CrVI (50 ppm) from 9.5 to 14.5 dpc. Placentas were separated on 18.5 dpc and processed for IHC. Representative images are shown for the expression of Prdx3 in MG (A, Control; B, CrVI; and C, histogram) and BZ (D, Control; E, CrVI; and F, histogram); LZ (G, Control; H, CrVI; and I, histogram) and YS (J, Control; K, CrVI; and L, histogram). EVT, endovascular trophoblast; iTC, interstitial trophoblast; SA, spiral artery; TGC, Trophoblastic giant cells. Each value represents mean ± SEM of 5 placentas. *Control versus CrVI, P <.05. Width of field for each image is 220 µm.

