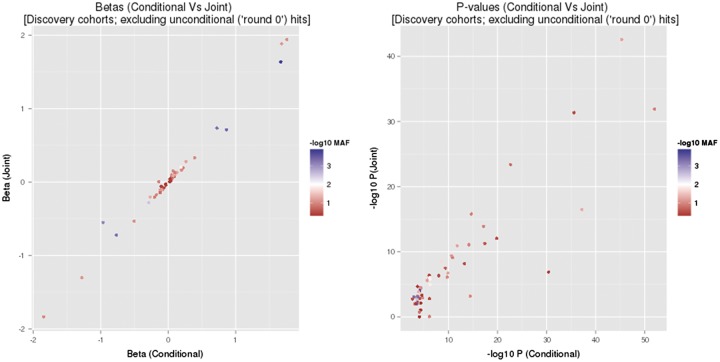
Figure 2.
Comparison of results between conditional and joint analyses. Note that these figures do not include the lead SNP in each region (i.e. round > 0 means that variants from the conditional analysis are shown only), as the conditional analyses do not produce adjusted estimates of their effects in contrary to the joint analyses.

