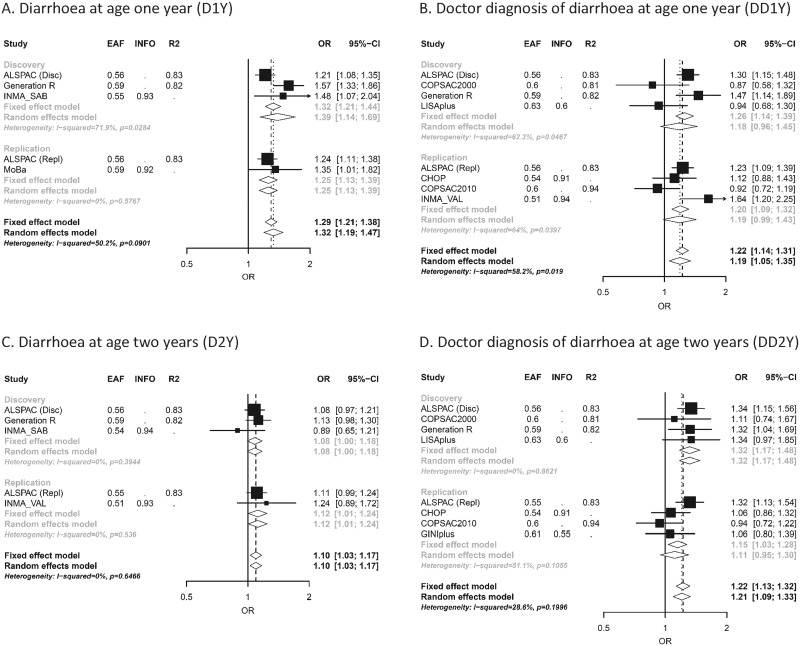
Figure 2.
Forest plots for rs8111874 at 19q13.33 for the four diarrhoeal outcomes: (A) Diarrhoea at age 1 year (D1Y); (B) Doctor diagnosis of diarrhoea at age 1 year (DD1Y); (C) Diarrhoea at age 2 years (D2Y); (D) Doctor diagnosis of diarrhoea at age 2 years (DD2Y). In the vertical panel, the studies participating in the discovery or replication phase are presented. In the horizontal lines, the sizes of the boxes represent precision and the lines the confidence intervals. The diamond shapes represent the pooled effect estimates, for both the fixed- and random-effect models. The horizontal axis shows the scale of the effect estimates. The effect allele is G, and the other allele is A.

