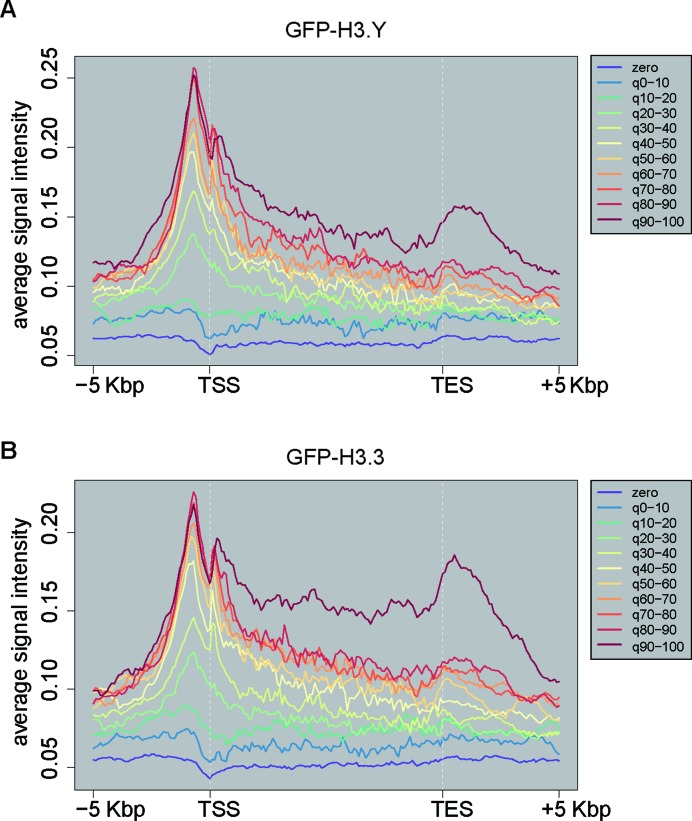
Figure 7.
Genomic distribution of H3.Y. (A and B) Average genome-wide ChIP-seq signal intensities of (A) GFP-H3.Y and (B) H3.3 on genes in HeLa cells. The genes were classified into 11 groups, according to their mRNA levels (See Materials and Methods for details). The distribution of GFP-H3.Y or GFP-H3.3 was analyzed within the region 5 kbp upstream of the TSS to 5 kbp downstream of the TES.

