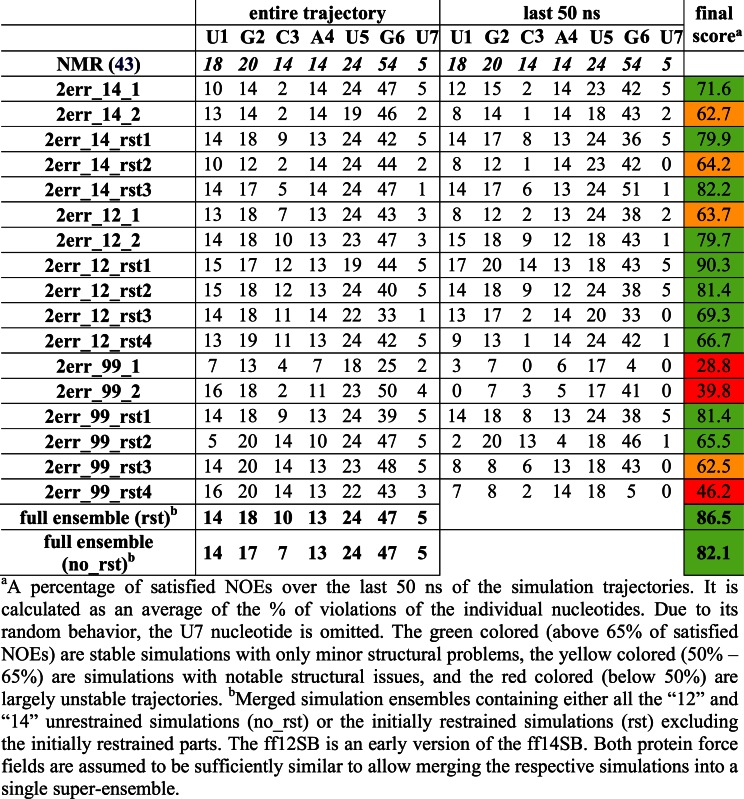
Table 2. Number of protein–RNA NOE distances that are satisfied in the simulations of the Fox-1 complex for the individual nucleotides (the number of the observed NOEs is given on the first line). Averaged values of weighted NOE distances (see Materials and Methods) calculated over the entire simulation trajectories and over the last 50 ns are used. Please see Supplementary Figures S5 and S6 for structure visualization of the NOE violations.

|
