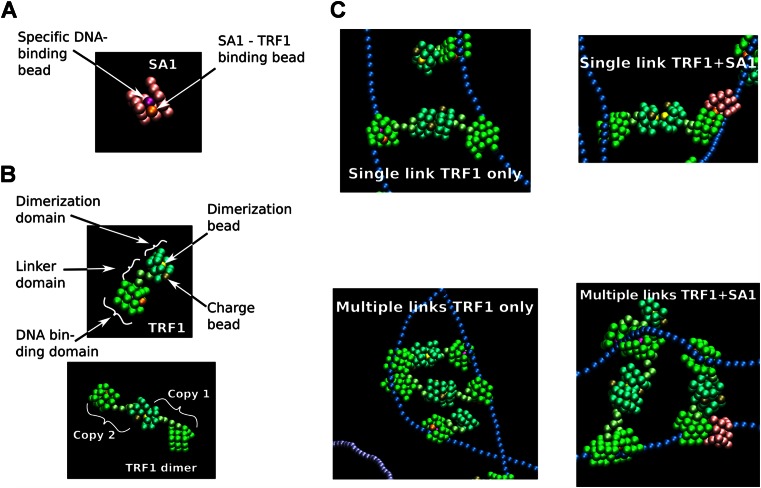
Figure 7.
MD simulations of TRF1 and SA1 DNA binding. (A and B) Coarse-grained structural models for SA1 (A) and TRF1 (B) used in the simulations. (C) TRF1 dimer mediated DNA–DNA pairing in the absence (left panels) or presence of interactions with SA1 (right panels). Examples of zoomed regions from MD simulations show single (top panels) and multiple TRF1-mediated DNA–DNA pairing (bottom panels). Overview pictures from MD simulations of SA1 alone and SA1 + TRF1 are shown in Supplementary Figure S10.

