Figure 4.
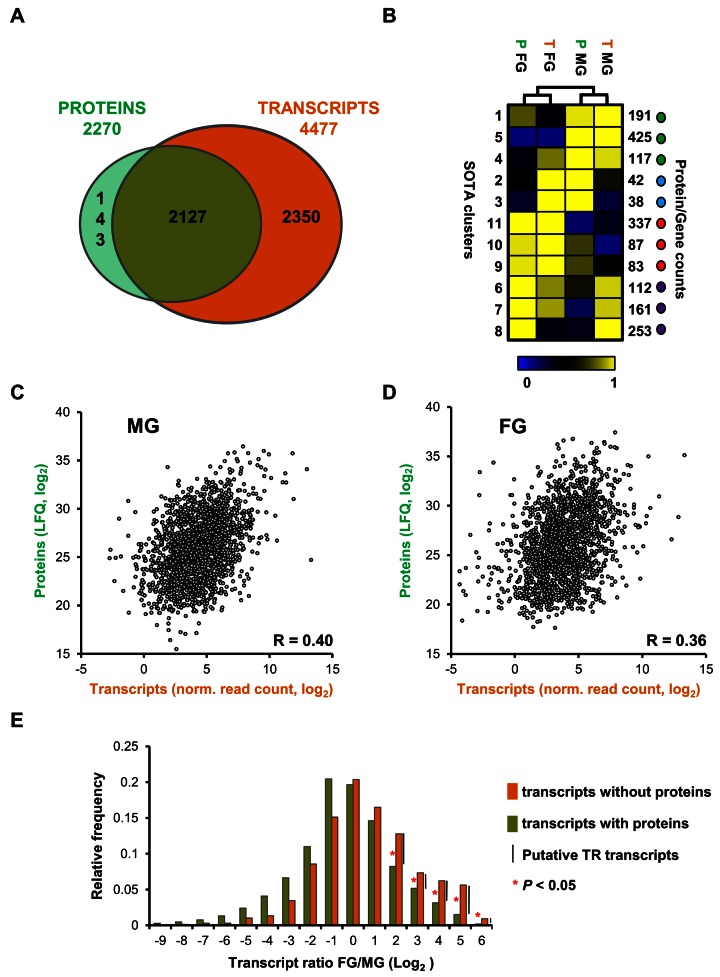
Comparison between transcriptome and proteome of purified P. falciparum MG and FG. (A) Venn diagram showing the overlap of genes identified in proteomes and transcriptomes (MG and FG combined). (B) Self-organising tree algorithm (SOTA) clustering of genes based on relative abundance of their transcripts and proteins identifies clusters of genes that are co-expressed (green and red dots) and clusters of genes that show opposite expression when transcript and protein levels are compared (blue and purple dots). (C) Scatter plot depicting protein abundance (log2LFQ) and transcript abundance (log2 (normalized read count)) for genes identified in purified MG. (D) Scatter plot depicting protein abundance (log2LFQ) and transcript abundance (normalized read count) for genes identified in purified FG. Pearson correlation values are shown in the corner of the plots. (E) FG/MG ratio distribution of transcripts with (green) or without (orange) protein evidence, showing that for upregulated genes in female gametocytes a significant higher percentage of genes has transcripts without proteins compared to genes with both transcript and protein.

