Figure 5.
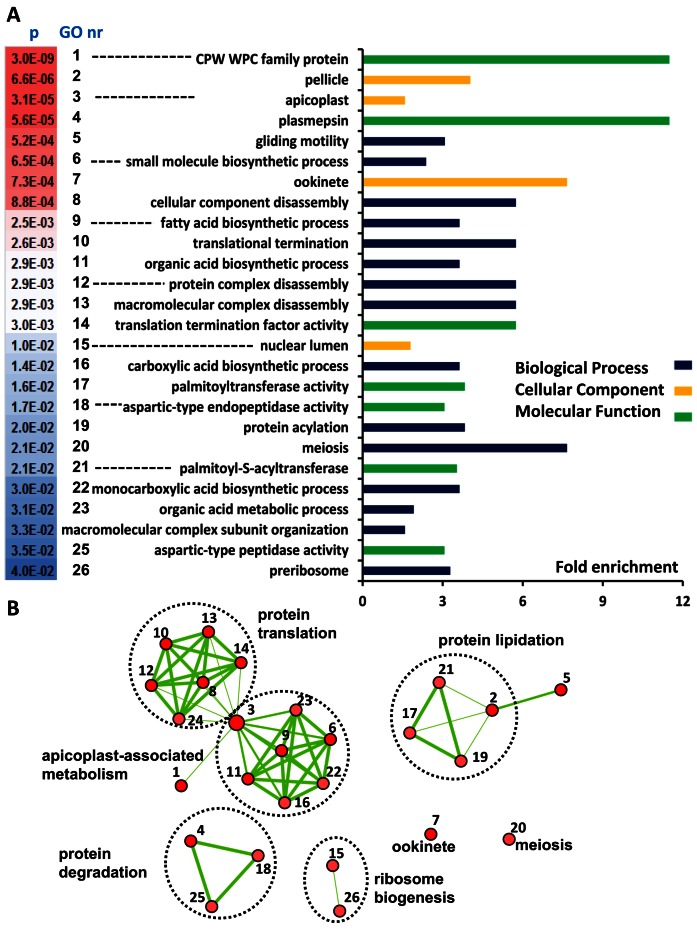
Gene Ontology Enrichment analysis of the putative set of TR transcripts in P. falciparum FG. (A) Fold enrichment of Gene Ontology (GO) terms of the putative set of TR transcripts relative to the background of all P. falciparum genes. Gene Ontologies representing Biological Processes are presented in dark blue lines, Cellular Component in orange and Molecular Function in green. (B) Enrichment map of GO terms in an interaction network. Nodes represent enriched GO terms with colour intensities reflecting statistical significance and numbers referring to descriptions provided in (A). Edges represent overlap between GO terms with line thickness correlating to the degree of overlap. Supplementary Table S12 provides the details of the GO enrichment analysis and the genes involved.

