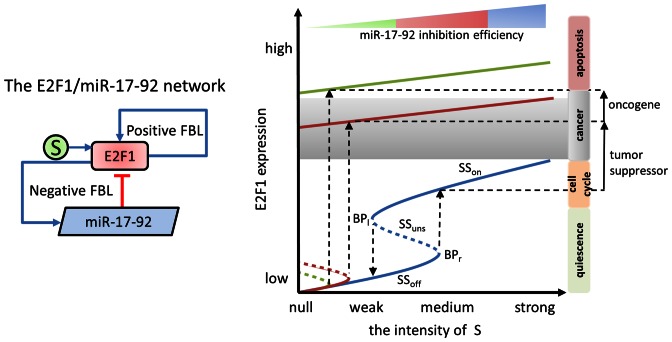
Figure 2.
Oncogenic and tumour suppressor property of the miR-17-92 cluster in the E2F network. The diagram illustrates an abstract model of the interactions between the miR-17-92 cluster and the E2F family. With the increasing intensity of the growth factor signal (S), the expression of E2F can switch between the ‘off’ and ‘on’ steady states (Soff and Son; the blue solid lines), but cannot stay on the unstable one (Suns; the blue dashed line). When the inhibition efficiency of the miRNA cluster decreases (the red and green lines), the switch of E2F from Son to Soff becomes irreversible, as the left bifurcation points (Bl) locate outside of the intensity interval of S, which contains biologically reasonable values. When cells express low E2F, decreasing miRNA inhibition efficiency results in a transition from the cell cycle zone to the cancer zone (i.e. shift from the blue line to the red line), showing the tumour suppressor property of the miRNA cluster. In contrast, when cells are already in the cancer zone, unchanged miRNA inhibition efficiency prevents them from exiting the cancer zone (i.e. shift from the red line to the green line), showing the oncogenic property of the miRNA cluster. The bifurcation plot is modified from (44).

