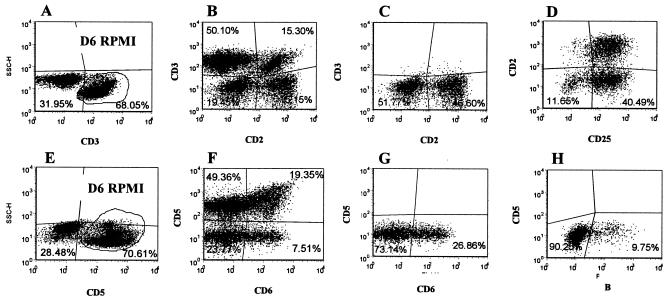
FIG. 4.
Representative dot plot profiles of PBMC from a control animal labeled with four MAbs after 6 days of culture in RPMI (Fig. 1B, MAb sets 1 [A to D] and 5 [E to H]). Dot plot profiles A to D, with selective and exclusion gates on 2 and CD3, show that null cells comprise two unique phenotypically distinct CD3− CD2− and CD3− CD2+ populations of cells. Profile A shows the frequency of CD3− and CD3+ cells present in gate 2. Profile B shows that the cells in gate 2 comprise four populations: CD3− CD2− null cells in the lower left quadrant, CD3+ CD2− γδ T cells in the upper left quadrant, CD3+ CD2+ αβ and γδ T cells in the upper right quadrant, and CD3− CD2+ null cells in the lower right quadrant. Profile C, with an exclusion gate on CD3, shows the frequency of CD3−, CD2− CD3−, and CD2+ populations of null cells in gate 2. Profile D, with an exclusion gate on CD3, shows that both null cell populations, CD3− CD2+ cells in the upper right quadrant and CD3− CD2− cells in the lower right quadrant, express CD25. Dot plot profiles E to H, with selective and exclusion gates on 2 and CD5, show that the two null cell populations do not express CD5 and that a subset of the null cells expresses CD6. Profile E shows the frequency of CD5− and CD5+ cells in gate 2. Profile F shows the cells in gate 2 comprise four populations: CD5− CD6− null cells in the lower left quadrant, CD5+ γδ T cells in the upper left quadrant, CD2+ CD6+ T cells in the upper right quadrant, and CD5− CD6+ null cells in the lower right quadrant. Profile G, with an exclusion gate on CD5, shows the frequency of CD6− and CD6+ null cells in gate 2. Profile H, with an exclusion gate on CD5, shows the frequency of residual B-B2+ B cells present in the culture.

