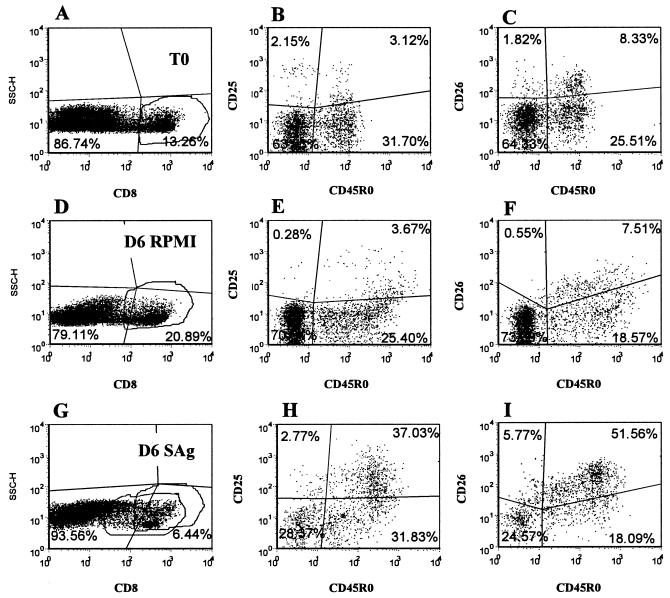
FIG. 6.
Representative dot plot profiles of CD8+ T cells from an infected animal labeled with four MAbs at T0 and after 6 days of culture in RPMI alone or with SAg (Fig. 1B, MAb set 3). A gate was placed on CD8+ T cells to analyze the expression of CD25 and CD26 on naïve and memory T cells present in gates 1 and 2. Profiles A, D, and G, SSC versus anti-CD8, show the frequency of CD8+ cells in the cell preparations in gates 1 and 2. Profiles B, E, and H, anti-CD25 versus anti-CD45R0, with a gate on CD8, show the frequency of CD25− naïve (lower left quadrant), CD25+ naïve (upper left quadrant), CD25+ memory (upper right quadrant), and CD25− memory (lower right quadrant) T cells. Profiles C, F, and I, anti-CD26 versus anti-CD45R0, with a gate on CD8, show the frequency of CD26− naïve (lower left quadrant), CD26+ naïve (upper left quadrant), CD26+ memory (upper right quadrant), and CD26− memory (lower right quadrant) T cells.

