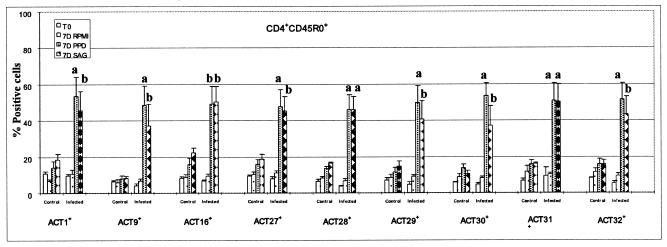
FIG. 9.
Summary of FC data on nine activation molecules upregulated on CD4+ CD45R0+ T cells 50 weeks following stimulation with PPD and M. avium subsp. paratuberculosis SAg. The significant differences between control animals and animals infected with M. avium subsp. paratuberculosis are as indicated in the figure (a, P < 0.01; b, 0.01 < P < 0.05).

