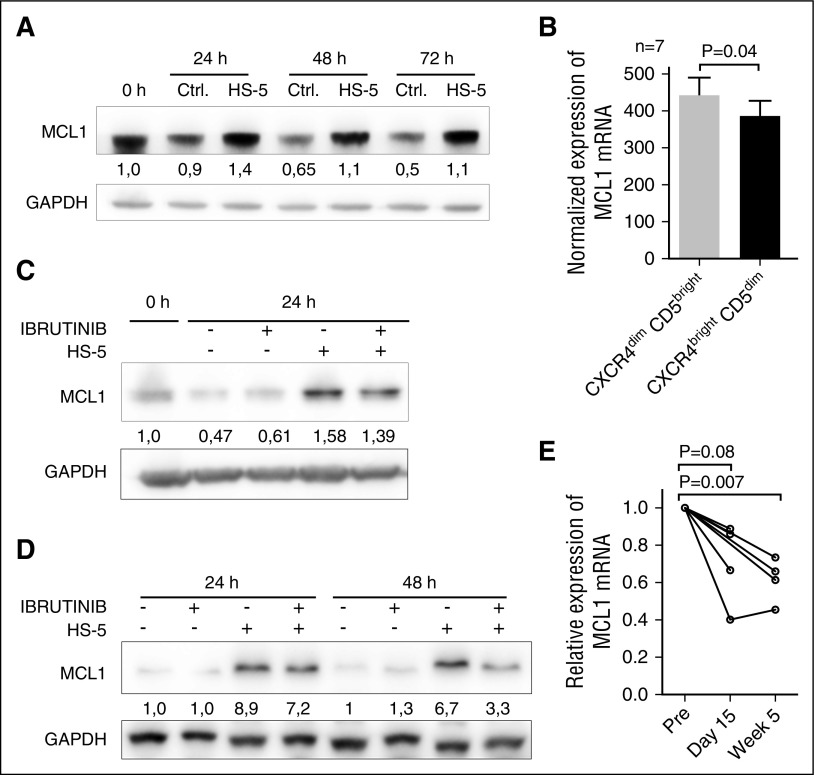
Figure 2.
The effect of microenvironmental interactions and ibrutinib treatment on Mcl1 expression. (A) Representative immunoblot analysis of Mcl1 expression in CLL cells (purity >95% CD5+CD19+ cells) after culture on plastic (Ctrl.) or coculture with HS-5 cells (HS-5) for 24/48/72 hours. The purification of CLL cells after coculture with HS-5 cells was performed using magnetic anti-CD105 MicroBeads (purity >95% CD5+CD19+ cells). The blot images were quantified with UVItec Alliance 4.7 (UVItec Cambridge), and the Mcl1/glyceraldehyde-3-phosphate dehydrogenase (GAPDH) in the first sample was arbitrarily set at 1. (B) Normalized Mcl1 mRNA expression in sorted CXCR4dimCD5bright and CXCR4brightCD5dim CLL cells (N = 7 pairs, purity >99% CD5+CD19+ cells). (C) Representative immunoblot analysis of Mcl1 expression in CLL cells after culture on plastic or coculture with HS-5 (with or without ibrutinib treatment). The presence of ibrutinib target BTK in CLL was confirmed by immunoblotting (supplemental Figure 8). The CLL cells were pretreated with ibrutinib (10 μM) or vehicle for 2 hours and then washed and seeded on plastic or confluent monolayer of HS-5 cells. The pretreatment of 2 hours with ibrutinib followed by washing was performed to minimize the off-target effects caused by the continuous ibrutinib presence. After the indicated cultivation period, all cells in the wells were harvested, and B-cell purification after coculture with HS-5 cells was performed using magnetic anti-CD105 MicroBeads (purity >95% CD5+CD19+ cells). The blot images were quantified with UVItec Alliance 4.7, and the Mcl1/GAPDH in the first sample was arbitrarily set at 1. Above each panel is a “+” or a “-” in the row labeled “ibrutinib” and/or “HS-5“ to indicate the samples that were exposed to ibrutinib or cocultured with stromal cells. (D) Representative immunoblot analysis of Mcl1 in the OSU-CLL cell line after culture on plastic or coculture with HS-5 (with or without treatment with ibrutinib). The presence of ibrutinib target BTK in OSU-CLL cell line was confirmed by immunoblotting (supplemental Figure 8). The experiment was performed identically as described in panel C for CLL cells. The Mcl1/GAPDH in the control sample was arbitrarily set at 1. (E) Relative Mcl1 mRNA expression in samples obtained before (Pre) and during ibrutinib treatment of CLL patients (time of sampling indicated). The gene expression was analyzed in samples with enough RNA material available (N = 7 patients; for characterization of CLL samples, see supplemental Table 1, sample no. CLL101-103 and 106-109 [other samples did not have enough RNA available]).

