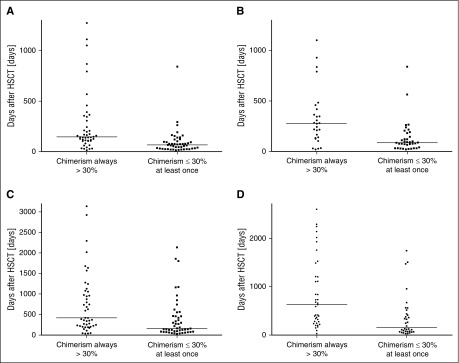
Figure 3.
Dynamics of loss of donor chimerism. The time interval is shown from first HSCT until overall (A) and CD3+ (B) DC fell below 75% and until overall (C) and CD3+ (D) DC reached the nadir. The intervals were significantly shorter in patients in whom the lowest DC was ≤30% compared with patients who always had a DC >30%. (A) P < .0001; (B) P = .0002; (C) P = .0018; (C) P = .0002.

