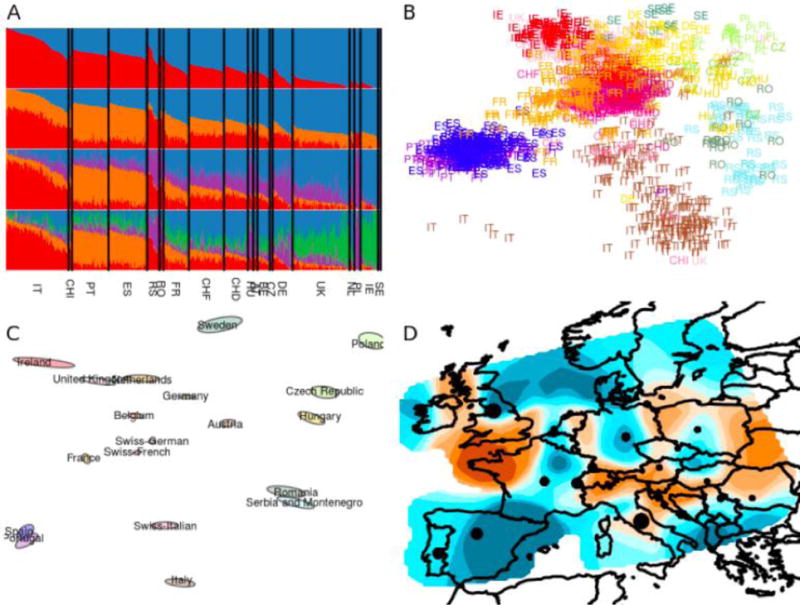
Figure 1. Four methods for assessing population structure using large-scale single-nucleotide polymorphism data.

A) Ancestry proportion inference using ADMIXTURE. B) Principal components analysis. C) Plot of population in ‘geogenetic’ space using SpaceMix. D) Visualization of effective migration rates using EEMS (brown = low effective migration; blue = high effective migration). Each method is applied to the dataset analysed in [92] after filtering out populations with fewer than 10 individuals, where population identifiers are defined on the basis of grandparental ancestry. Structure is visible, even though FST-values average 0.004 between broad geographic regions in Europe [92].
