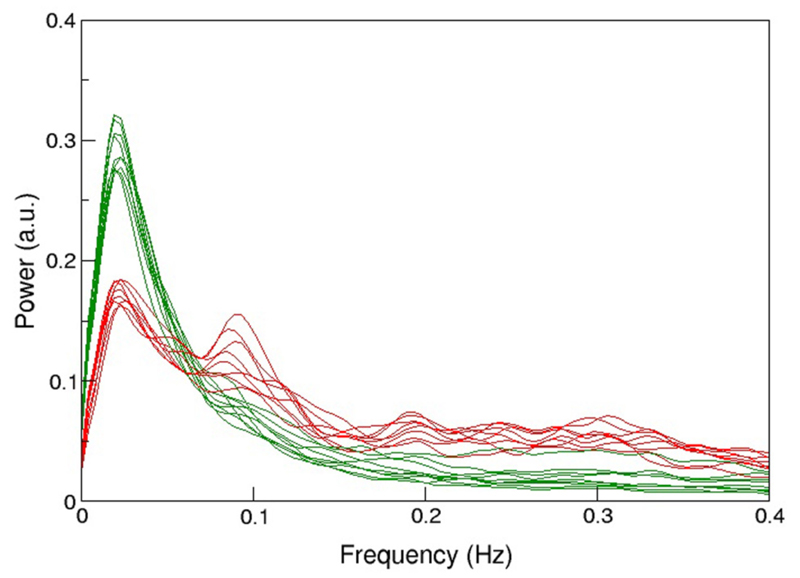
Figure 1. Comparison of the mean spectral distribution of 12 resting-state networks shown in green (i.e., from medial visual, motor, cerebellum, lateral visual, posterior parietal, left-lateral fronto-parietal, temporal, medial frontal, default-mode, to limbic lobe, basal ganglia, right lateral fronto-parietal and anterior temporal lobe, in descending order of explained variance) and various physiological noise components in red.
Experiments were performed at 3T (n = 26), TR/TE = 1000/28 ms (3.3 × 3.9 × 4 mm3 voxel resolution) during 5 min, and at 4T 3 (n = 15), TR/TE =2200/33 ms (3 × 3× 3 mm3 voxel resolution) during 10 min sessions. For more details see Robinson [31]. Note the high power of noise components between 0.01 and 0.1 Hz, not to be eliminated via bandpass filtering, and limiting the detection of more resting-state networks or subtle differences between networks in group studies.

