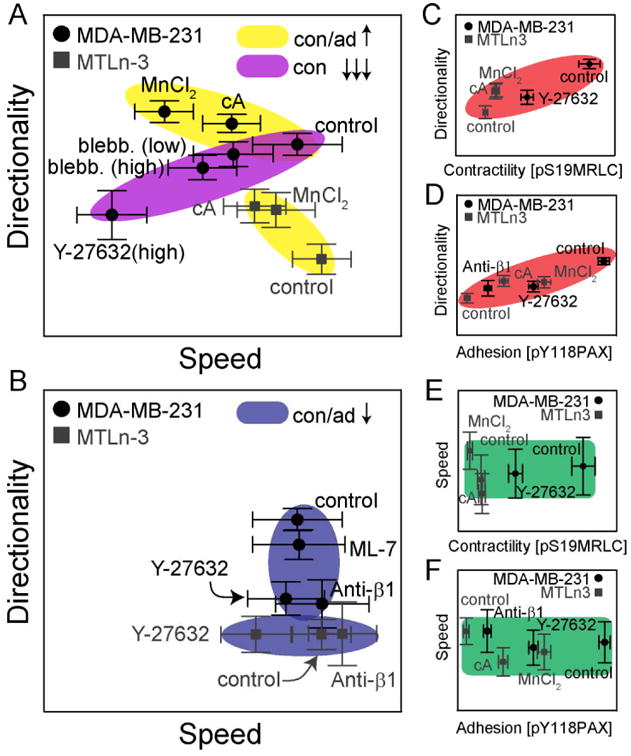
Figure 9. Schematic showing directionality and speed dependence on contractility and adhesion across different cell lines.

(A and B) Migration directionality as a function of migration speed across different cell lines and perturbations. Colored regions represent classes of similar perturbations (Yellow: contractility and adhesion increases, Purple: large changes in contractility and Blue: contractility and adhesion decreases). Migration (C and D) directionality and (E and F) speed in MDA-MB-231 cells (black) and MTLn3 (grey) cells as a function of contractility and adhesion as measured by pS19-MRLC (contractility) and pY118-Pax (adhesion) signals. Axes ranges are not explicitly defined, but are function of the migration directionality, migration speed or staining intensity. Error bars are 95% confidence intervals.
