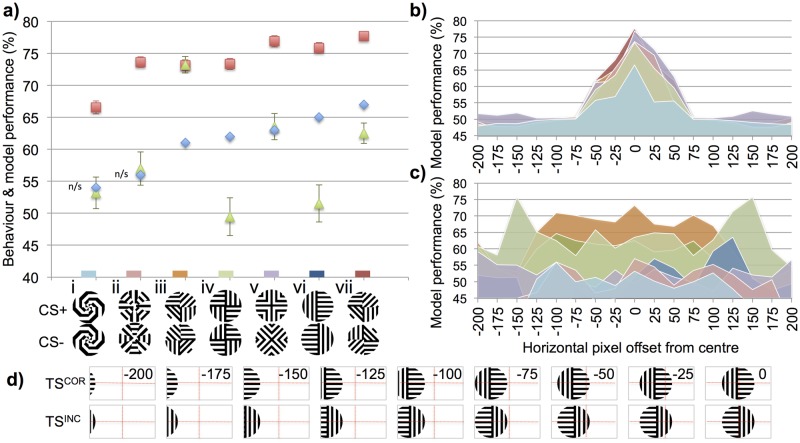
Fig 2. Model results for experiment set 1. Exemplary summary of honeybee behaviour and model performance for the discrimination tasks.
In the behavioural experiments [18] different groups of honeybees were differentially trained on a particular pattern pair, one rewarding (CS+) and one unrewarding (CS-). (a) Blue diamonds: honeybee result, percentage of correct pattern selections after training. Red squares: performance accuracy of the DISTINCT simulated bee when test stimuli were presented in the centre of the field of view. Green triangles: performance accuracy of the MERGED simulated bee for the centralised stimuli. Error bars show standard deviation of the Kenyon cell similarity ratios (as a percentage, and centred on the simulated bee performance value; which was equivalent to average Kenyon cell similarity ratio over all simulation trials). Standard deviations were not available for the behaviour results. Small coloured rectangle on x-axis shows the corresponding experiment colour identifiers in (b, c). (b, c) Performance accuracy of the DISTINCT (b) and MERGED (c) simulated bees when comparing the rewarding patterns (CS+) with the corresponding correct (TSCOR) and incorrect (TSINC) pattern pairs when these patterns were horizontally offset between 0 and ±200 pixels in 25 pixel increments (see d). Colour of region indicates the corresponding experiment in (a), performance at 0 horizontal pixel offset in (b), (c) is therefore also the same corresponding DISTINCT or MERGED result in (a) (d) Example of the correct and incorrect pattern images when horizontally offset by -200 pixels to 0 pixels, similar images were created for +25 pixels to +200 pixels. Experiment images were 300 x 150 pixels in size; patterns occupied a 150 x 150 pixel box cropped as necessary. Number in top right of each image indicates number of pixels it was offset by; these were not displayed in actual images. Red dotted lines show how pattern was subdivide into the dorsal left eye, dorsal right eye, ventral left eye and ventral right eye regions. Each region extended a lobula orientation-sensitive neuron of type A and a type B to the models’ mushroom bodies (see Fig 1). The DISTINCT simulated bee performs much better than the MERGED model’s simulated bee and empirical honeybee results when there is no offset in the patterns (a), but with only a small offset (±75 pixels) the DISTINCT simulated bee is unable to discriminate the patterns (b) whereas the simulated bee based on the MERGED model is able to discriminate most of the patterns over a large range of offsets (c).

