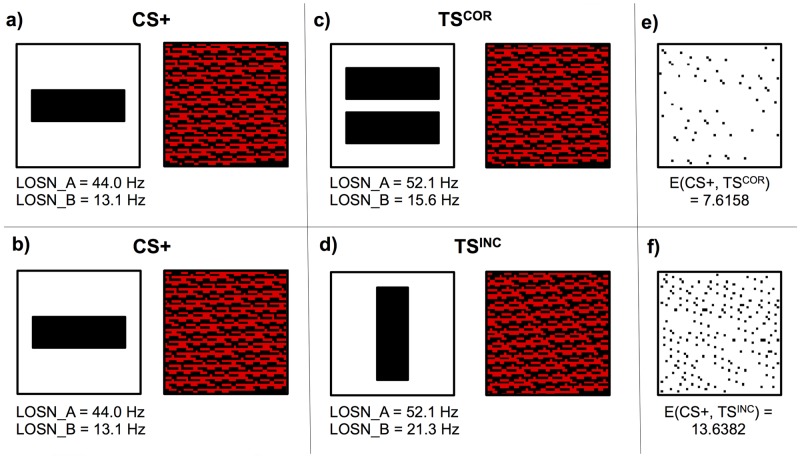
Fig 7. Worked example of LOSN firing rate response calculations. Simplified example of the lobula orientation-sensitive neuron (LOSN) type A and type B firing rate response calculations.
(a, b) Left: rewarding pattern (CS+) (single horizontal bar). Here we used the DISTINCT model to calculate the Kenyon cell activations to this pattern. Right: graphical representation of all Kenyon cell activations (red: fired, black: inhibited). In these example we again only processed the top-left quadrant of the visual field (see Fig 6). (c) The correct test stimulus (TSCOR) and the resultant Kenyon cell activations. (d) Incorrect test stimulus (TSINC) and its Kenyon cell activation pattern. (e) Black dots show if differences occur between the activation of respective Kenyon cells when presented with rewarding pattern and correct test patterns. (f) Differences between the rewarding and incorrect stimuli Kenyon cell activations. The rewarding (CS+) and correct test stimuli (TSCOR) both present mostly horizontal edges; however due to the difference in edge lengths, the lobula orientation-sensitive neuron firing rates are markedly different. Nonetheless, the combination of excitatory and inhibitory synaptic connections from these lobula neurons to the Kenyon cells (see Table 1) produces very similar Kenyon cell activations. Using the Euclidian distances between the Kenyon cell activations of the CS+ and TSCOR, and CS+ and TSINC responses this simulation produced a Kenyon cell similarity ratio of (1 − (7.6158 / (7.6158 + 13.6382))) = 0.64 (see Eq 2); indicating that for this simulation our DISTINCT model would generalize from the single horizontal bar pattern (CS+) to the two horizontal bars pattern (TSCOR), in preference to the single vertical bar stimulus (TSINC).

