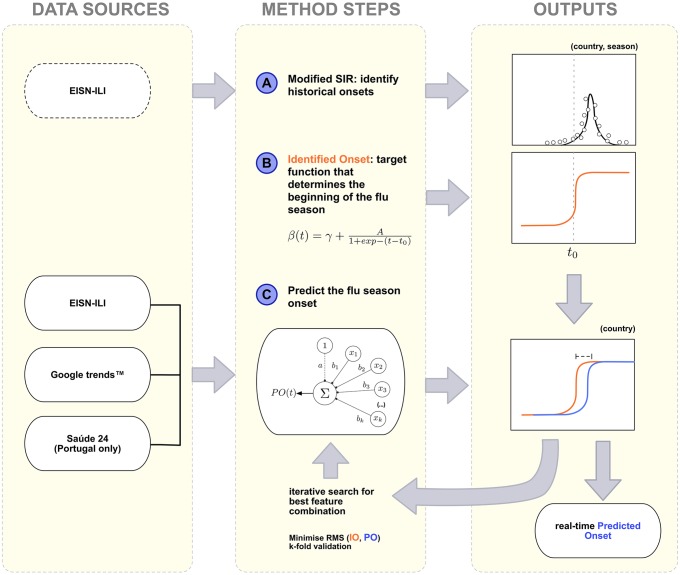
Fig 1. 3-step flow diagram.
Data Sources and diagrammed Method used in this study. Left column (labelled Data Sources) shows the different data used at the different stages; the middle column (labelled Methods Steps) shows the different methods and approaches developed; the column on the right (labelled Outputs) shows the fits and curves used for comparison. A) First step (top row, left to right): from the EISN-ILI data and by applying a Modified SIR model, the onset of five consecutive Influenza seasons was identified (represented by the dashed vertical line in the top plots, “Outputs” column, t0); B) Second step: an Identified Onset (IO) function is defined and centred at the previously found onset week (B and orange line on the “Outputs” column); C) Third Step: alternative ILI-related data sources (bottom left column) were used as input to create a Prediction Onset (PO) function (blue line, bottom right column), with the Identified Onset (orange line) function as the target output. The Predicted Onset is chosen in an iterative process, as the one that minimizes the difference to the Identified Onset. This function is fixed and then used for real-time prediction.

