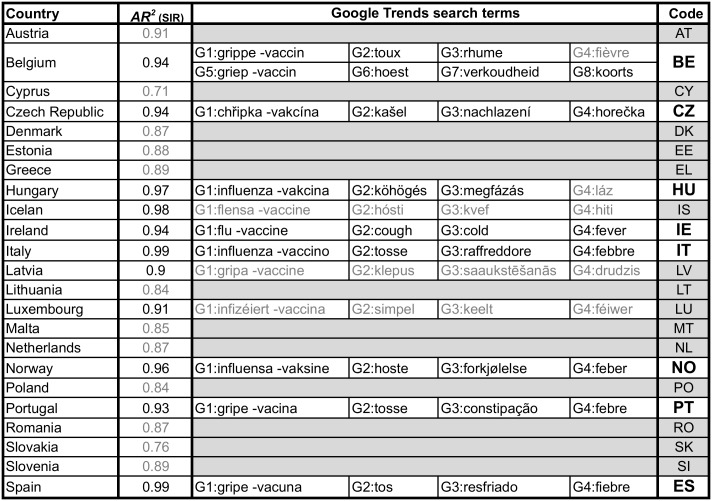
Fig 2. Countries analysed and GT search terms.
First column shows the 23 countries for which EISN data was collected. Second column is the Averaged Adjusted R2 resulted from the MSRI fit. Grey font represents countries that did not fulfil the two selection criteria (AR2 > 0.9 and convergent fit in all seasons) and were eliminated. Columns 3 to 6 show the GT terms searched for in each country. Grey font represents searches that did not have enough GT search volume. Countries that did not have at least three GT time series were eliminated, so that the final set includes countries with at least two independent sources of data. Last column shows the country codes used, with grey cells marking the countries that were discarded and white bold cells the eight countries that were further analysed in this study.

