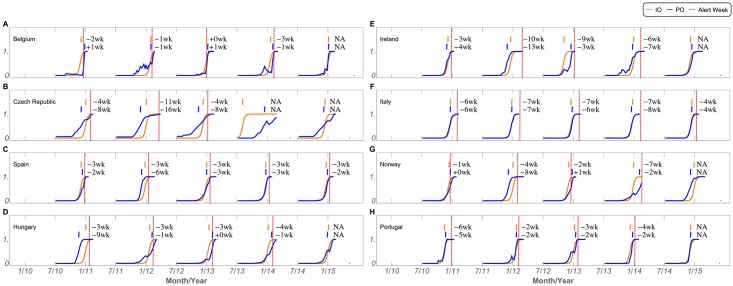
Fig 7. Onset anticipation.
Identified Onset (IO, orange line), Predicted Onset (PO, blue line), and official alert week (Alert, dashed red line) for all seasons (x-axis) and countries (panels A to H). Onsets are identified at the inflection points of the curves, at 0.5. Week differences between IO, PO and the Alert are shown at the top, by season, in orange and blue, respectively. A minus sign means that the model anticipated the official alert and a plus sign means that the model was delayed in comparison with the official alert. NA means that at the time of collection, no official alert was available.

