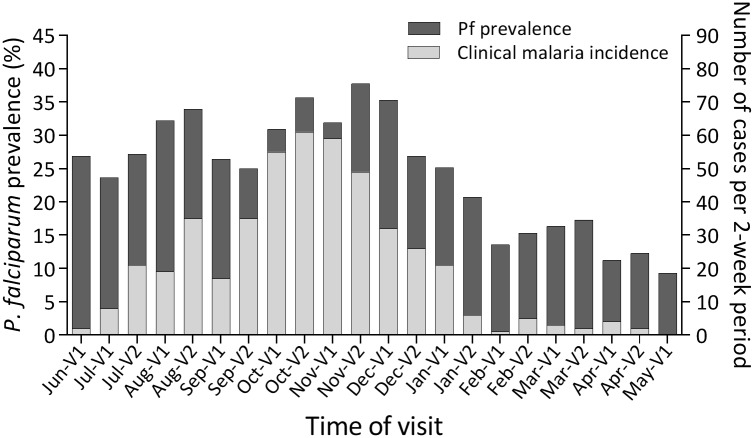
Fig 1. Cross-sectional prevalence of P. falciparum (Pf) infection and 2-week incidence of clinical malaria from June 2013 to May 2014.
Left y-axis: Pf prevalence measured by nested-PCR; dark gray bars represent Pf prevalence. Right y-axis: number of clinical malaria cases recorded during each 2-week period preceding a blood sampling visit; light gray bars represent 2-week incidence. The time of visit is indicated on the x-axis, with V1 and V2 indicating the first and second blood sampling visits, respectively, for the months indicated.

