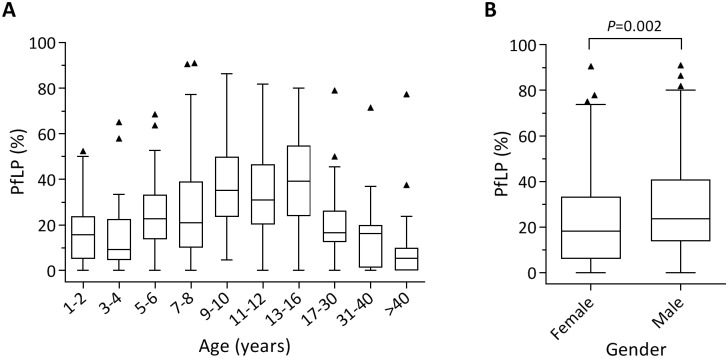
Fig 2. P. falciparum longitudinal prevalence (PfLP) stratified by age (A) and gender (B).
Subjects were divided into 10 age groups (A) based on their age and number of subjects so that each group contained around 10% of the cohort (38 to 61 individuals per group, Table 1). Box-and-whisker plots show median, interquartile range (IQR), 1.5x IQR, and outliers (triangles). Differences between age groups were analyzed by Kruskal-Wallis test followed by Dunn’s multiple comparison test (see S4 Table for adjusted P values). PfLP differed significantly by gender (P = 0.0024, Mann-Whitney test).

