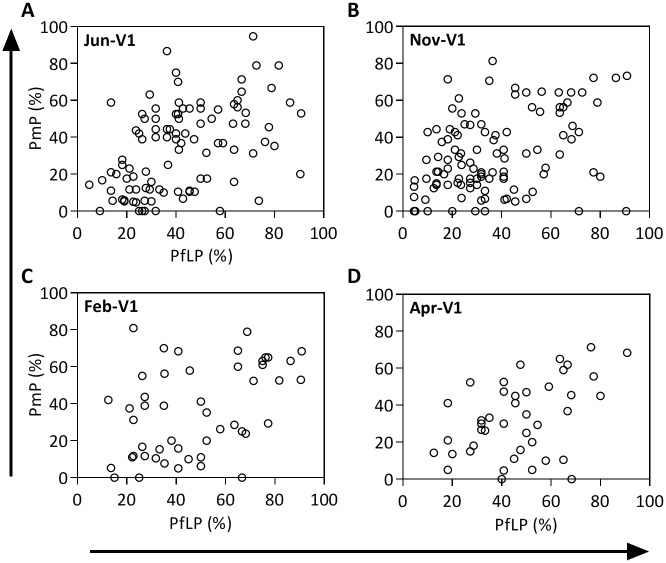
Fig 4. Correlation between polymorphic proportion (PmP) and P. falciparum longitudinal prevalence (PfLP).
PmP positively correlates with PfLP at all 4 time-points: (A) Jun-V1 (r = 0.47, 95% confidence interval = 0.30–0.61, P<0.001, Spearman rank correlation test); (B) Nov-V1 (r = 0.36, 0.18–0.52, P<0.001); (C) Feb-V1 (r = 0.42, 0.15–0.63, P = 0.003); and (D) Apr-V1 (r = 0.39, 0.09–0.63, P = 0.011)

