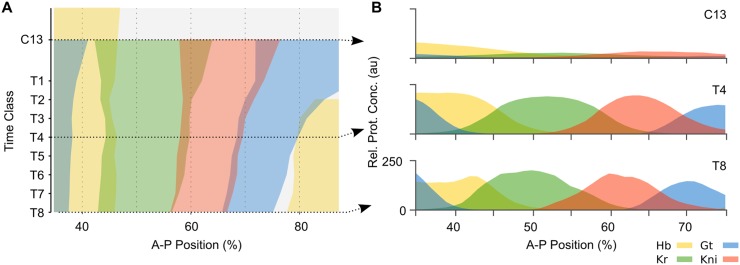
Fig 1. Dynamics of gap gene expression.
(A) Space-time plot of protein expression data for the trunk gap genes during the late blastoderm stage in D. melanogaster. Coloured areas demarcate regions with relative protein concentration above half-maximum value. Time flows downwards along the y-axis. (B) Cross-sections of gene expression in (A) at cycle C13 and time classes C14A-T4 and T8 (dashed arrows in (A)). Y-axes indicate relative protein concentration in arbitrary units (au). In both panels, x-axes represent %A–P position, where 0% is the anterior pole. Hunchback (Hb) is shown in yellow, Krüppel (Kr) in green, Knirps (Kni) in red, and Giant (Gt) in blue. C13: cleavage cycle 13; C14A-T1–8: cleavage cycle 14A, time classes 1–8 (see Models and Methods for details).

