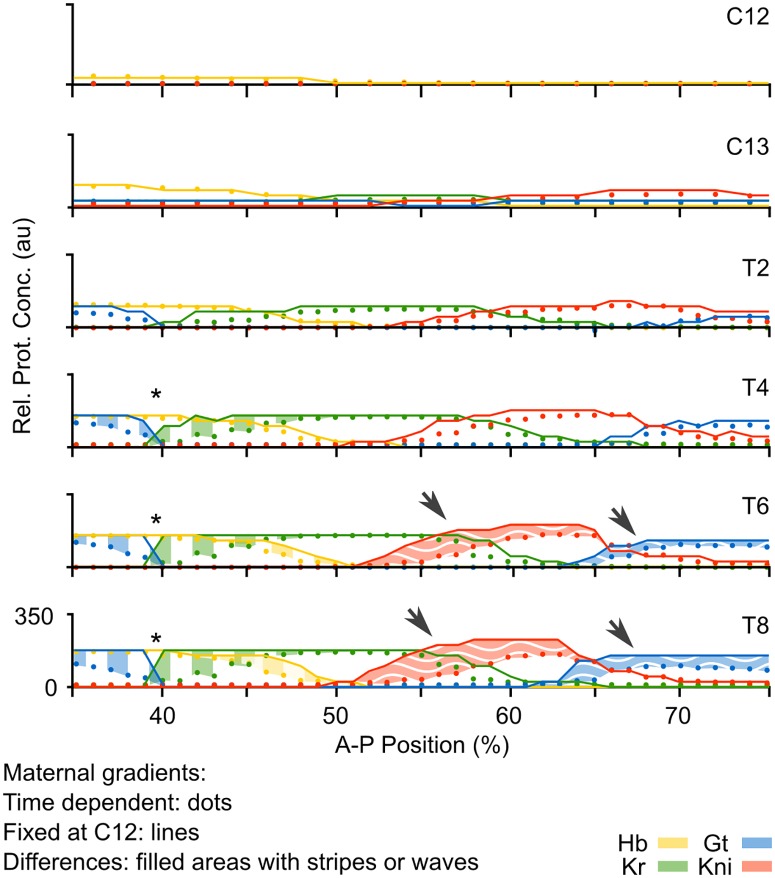
Fig 4. Effect of the time-dependence of maternal gradients on gap gene pattern formation.
(A) Plots show output from the non-autonomous gap gene circuit with time-variable maternal gradients (dots), compared to output from the same model with maternal gradients fixed to their values at cycle C12 (early blastoderm stage; lines). Y-axes represent relative protein concentrations in arbitrary units (au); x-axes represents %A–P position, where 0% is the anterior pole. Differences between the two model simulations are shaded using vertical stripes in the anterior trunk region, and wavy horizontal stripes in the posterior. Asterisks mark over-expression in the region of the Gt/Kr interface; arrows mark “overshoot” of gap domain shifts in the posterior of the embryo.

