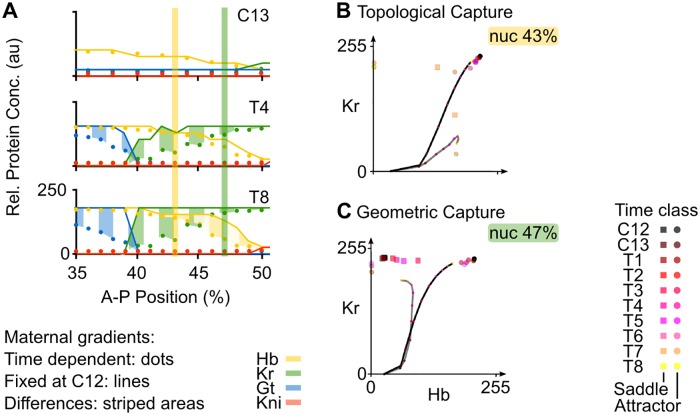
Fig 6. Positioning the Hb-Kr interface.
Output of the non-autonomous gene circuit (dots) versus the same model without maternal gradient decay (lines) shown at cleavage cycle C13 and C14A (time classes T4 and T8) for nuclei between 35–52% A–P position. Axes and colouring scheme as in Fig 3B. Yellow and green vertical bars mark the nuclei at 43% and 47%A–P position shown in (B) and (C) respectively. (B) Phase portrait for nucleus at 43% position. (C) Phase portrait for nucleus at 47% position. Phase portraits are shown as two-dimensional projections onto the plane defined by Hb (x-axis) and Kr (y-axis) concentrations (in arbitrary units, au). Non-autonomous trajectories are shown as grey lines and autonomous trajectories, as black lines. Point attractors are represented by spheres and saddles points by squares. Small coloured dots on the trajectories indicate the position in phase space (Hb and Kr concentrations) of the trajectory at different time points. Colouring of attractors and trajectory positions indicates time class (see key). Other steady states have been omitted for clarity, since they do not shape trajectories in these nuclei. See text for details.

