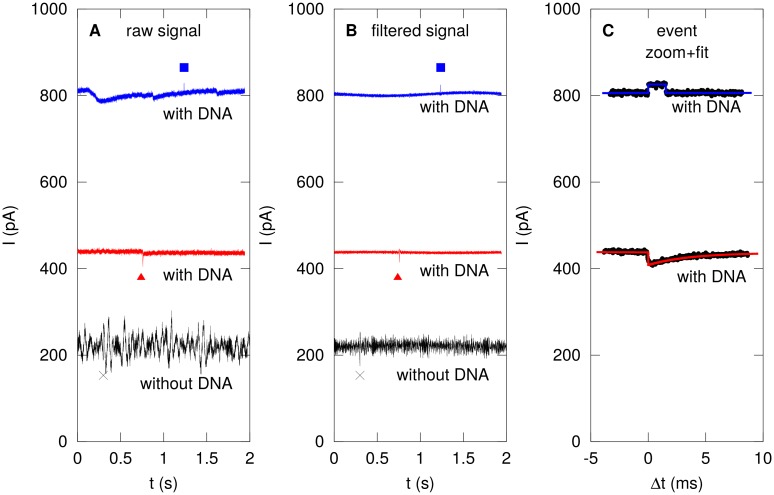
Fig 4. Event detection and classification.
(A) Raw current traces are recorded as described without DNA (black) and with DNA (red, blue). Eventual determination of rectangular and exponential events are indicated by blue square and red triangle, respectively. A dip in the control experiment (×) is discarded as a possible event as described in the text. (B) Narrow-band noise is removed from the traces and eventual event position is indicated. (C) Events are fitted with rectangular (blue) or exponential (red) traces depending on which fits better statistically.

