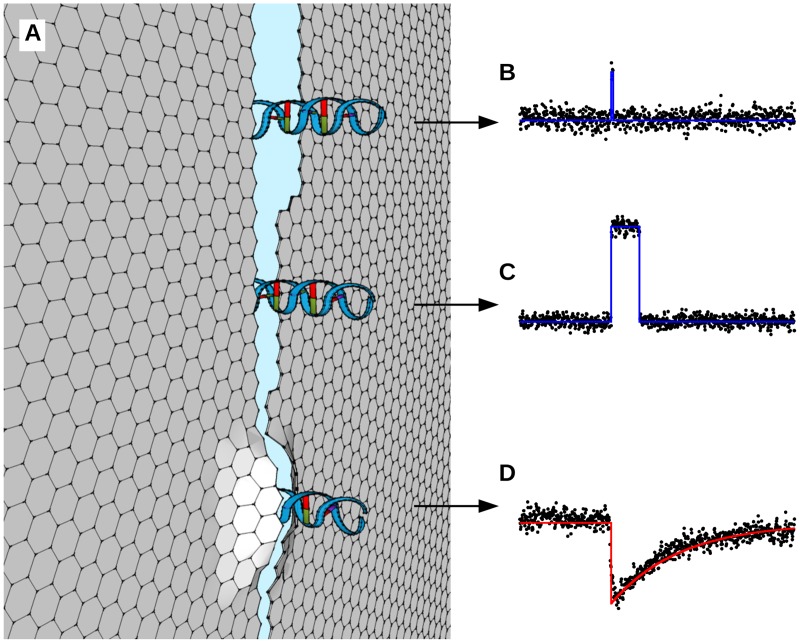
Fig 6. Effect of local nanogap geometry on translocation events, showing gaps and associated event data.
(A) Illustration of continuously changing gap width over the length of the gap. As DNA translocates through the gap, its passage is characterized by the gap width at its point of traversal. (B) DNA passes through the upper gap, causing a rectangular conductance change. (C) DNA passes through the middle gap more slowly due to the narrower gap diameter. (D) DNA forces the edges of the lower gap to bend outward, which then relax to their equilibrium position once it has passed, causing an exponential decay event.

