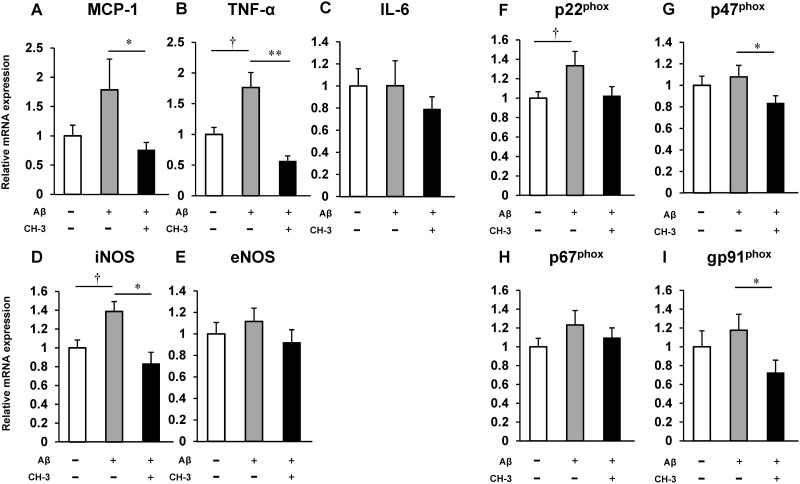
Fig 2. Change in mRNA expression of inflammatory cytokines and NADPH oxidase subunits in hippocampus of AD model mice by CH-3 treatment.
mRNA expression of MCP-1 (A), TNF-α (B), IL-6 (C), iNOS (D), eNOS (E), p22phox (F), p47phox (G), p67phox (H) and gp91phox (I) in hippocampus. n = 8–12 mice in each group. †P<0.05 vs. control, *P<0.05 or **P<0.01 vs. Aβ1–42 (+).

