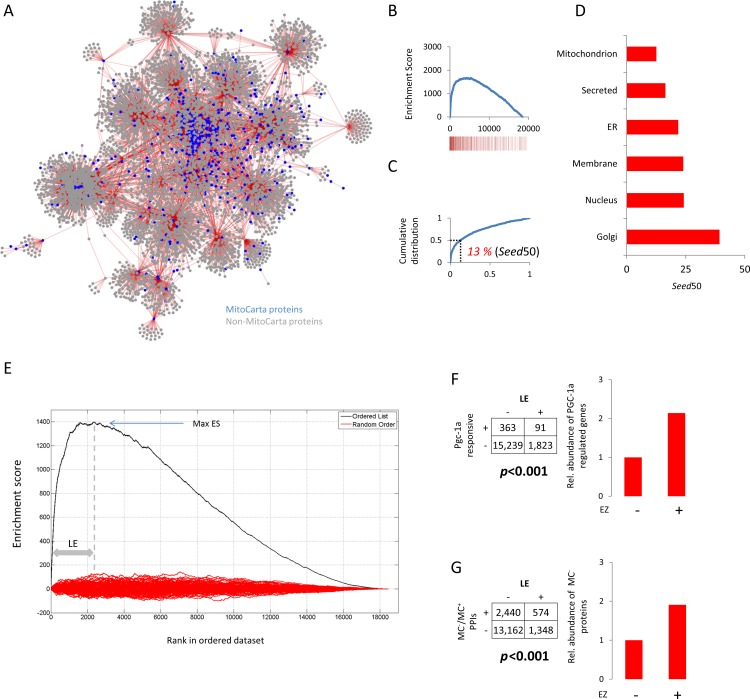
Fig 1. Construction of a mitochondrion-centric multi-tissue gene co-expression network.
A, 935 bona fide MPETs [10] were systematically queried using the CO-Regulation Database (CORD) to identify transcripts with similar expression signatures. The resulting correlate lists were merged to create a network where nodes denote transcripts and edges join transcripts with concordant expression signatures. For any node, the extent of centrality in the network correlates with increasing connectivity. For ease of viewing, only transcripts that correlate at R≥0.8 are displayed. B, Individual correlate lists derived from CORD were concatenated to generate a ranked master list where rank is based on the number of times a given transcript was present across all daughter lists. A running-sum (Enrichment Score) was then generated by descending the list and assigning a positive score (up-step) when a transcript was a seed and a negative score (down-step) when it was not. The barcode denotes positions in ranked list of the seed population. C, Cumulative distribution analysis of the ranked master list from B to quantify the extent of network intra-correlation, expressed as the percentage of the list containing half the seed population, reveals half of the seeds used to build the network were present in the top 13% of the ranked transcript list (seed50 = 13%). D, Comparison of seed50 values across all six major cell compartments following CORD-based network analysis. E, Data from B (mitochondrion) showing the maximum Enrichment Score (Max ES, ~1,400) and resulting leading edge (LE). The red lines denote the ESs calculated following 1000 random walks. F, Distribution of Pgc-1α-responsive transcripts within and beyond the LE sub-set. Matrix displays the number of transcripts within (+) and outside (-) the LE, regulated (+) or not (-) by Pgc-1α and the bar chart displays relative abundance. G, Distribution of proteins not documented as being mitochondrially-localised but which purportedly interact with known mitochondrial proteins, according to publicly accessible proteomics data, within and beyond the LE sub-set. Matrix displays the number of proteins within (+) and outside (-) the LE, purported to interact with known mitochondrial proteins based on analysis of BioGRID protein-protein interaction (PPI) data [40] and the bar chart displays relative abundance. MC+ and MC- denote MitoCarta and non-MitoCarta proteins, respectively. For example, there were 574 transcripts in the LE whose protein products have not been documented to produce mitochondrial proteins but which have been reported to interact with known mitochondrial proteins. The P values in F and G correspond to the result of a Chi-squared test and a Fisher Exact Test (FET), respectively.

