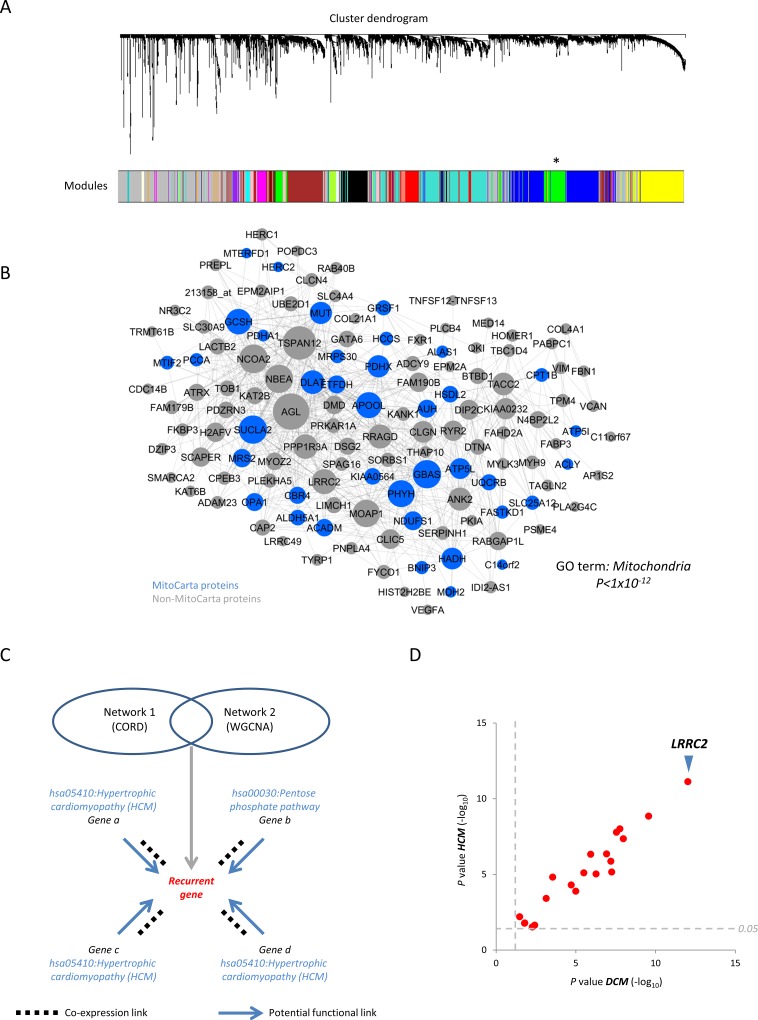
Fig 2. Weighted gene co-expression network analysis (WGCNA) of a human cardiac gene expression dataset and nomination of proteins potentially involved in mitochondrial and cardiac function.
A, Dendrogram representation of the 27 transcript modules derived from WGCNA of a human heart failure microarray dataset (comprising healthy (n = 16), ischemic heart failure (n = 86) and idiopathic heart failure (n = 108) samples). Horizontal lines (branches) represent modules and vertical lines (leaves) represent transcripts. Asterisk denotes an MPET-enriched (green) module. B, Green module from A where transcripts are represented as nodes (size denotes matrix membership (see Methods)) and edges denote significant transcript-transcript correlations. C, Schema illustrating candidate selection following CORD and WGCNA studies. Genes nominated by both analyses were re-processed with CORD to recover co-expressed genes and KEGG terms associated with those genes. In this illustrative example, all genes that correlate with the Recurrent gene apart from Gene b are linked to Hypertrophic Cardiomyopathy suggesting that the Recurrent gene may also be functionally linked. D, Scatter plot showing the sub-set of recurrent genes (24 of 78) that correlate with a disproportionately large number of genes linked to Hypertrophic Cardiomyopathy (HCM) and Dilated Cardiomyopathy (DCM). X and Y axes denote the EASE scores (a measure of ontological enrichment [44]), expressed as -log10 P values, corresponding to DCM and HCM KEGG terms, respectively. Grey dashed lines denote the P≥0.05 EASE threshold.

