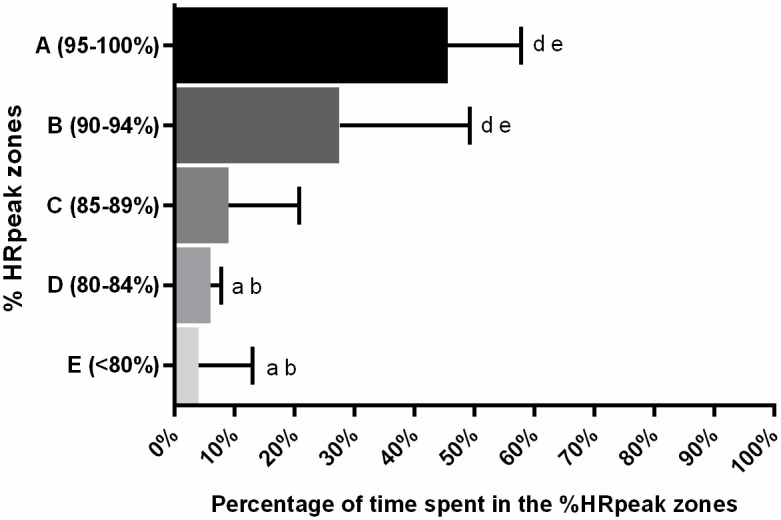
Fig 4. Percentage of time spent in specific heart rate intensity zones during the combat simulation.

Significant differences confirmed in Friedman test, with Dunn post-hoc (p<0.05). a Denotes significant different from the 95–100% zone. b Denotes significant different from the 90–94% zone. d Denotes significant different from the 80–84% zone. e Denotes significant different from the <80% zone.
