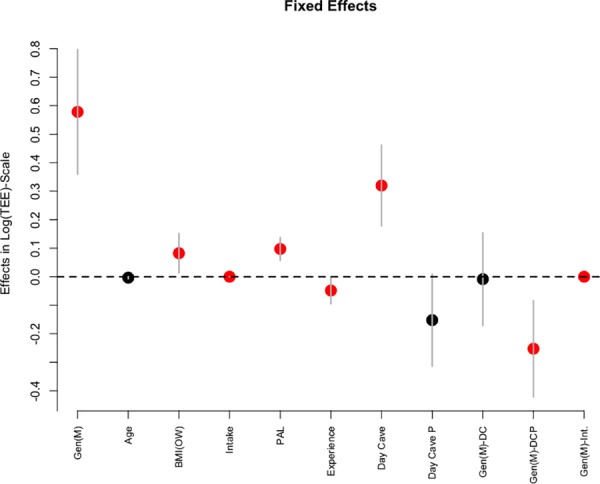
Fig 6. Bayesan linear regression estimate of the effect of predictive variables on total energy expenditure.

Mean effects (bullets) along with 95% posterior credible intervals. Significant effects are in red. GEN (M), gender (men); BMI (OW), BMI class (overweight); PAL, Physical Activity Level; Day cave P, Day cave, partial; GEN (M)–DC, gender (men)—Day cave; GEN (M)–DCP, gender (men)—Day cave, partial; GEN (M)–INT, gender (men)–intake.
