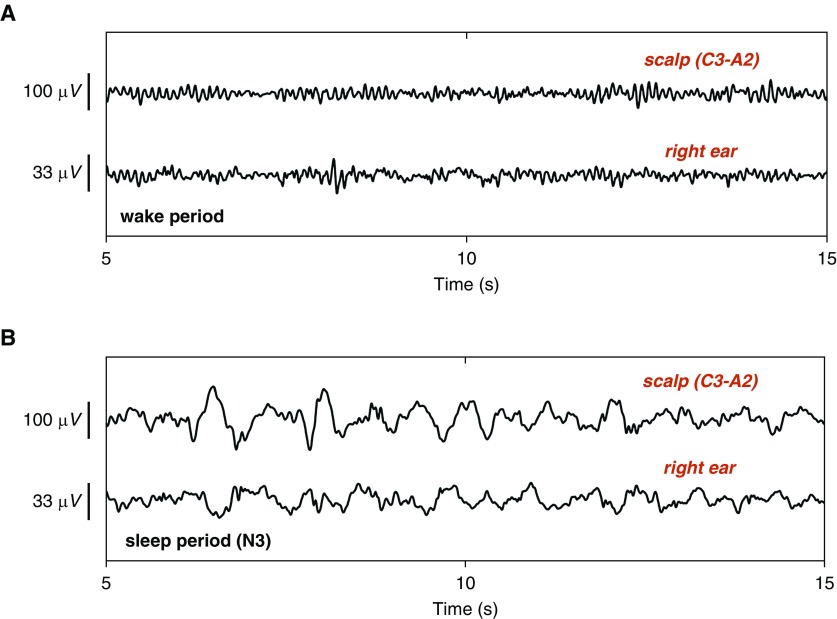
Figure 2.
Time-domain EEG recorded from scalp and ear electrodes: 15 seconds of ear- and scalp-EEG obtained during (A) wake and (B) stage N3 sleep. Observe the presence of α activity (8–13 Hz) in ear-EEG in A, and the absence of α activity in B, as well as increased θ (4–7 Hz) and δ (1–3 Hz) activity. For reference, the simultaneously obtained trace using a conventional scalp electrode is also shown.

