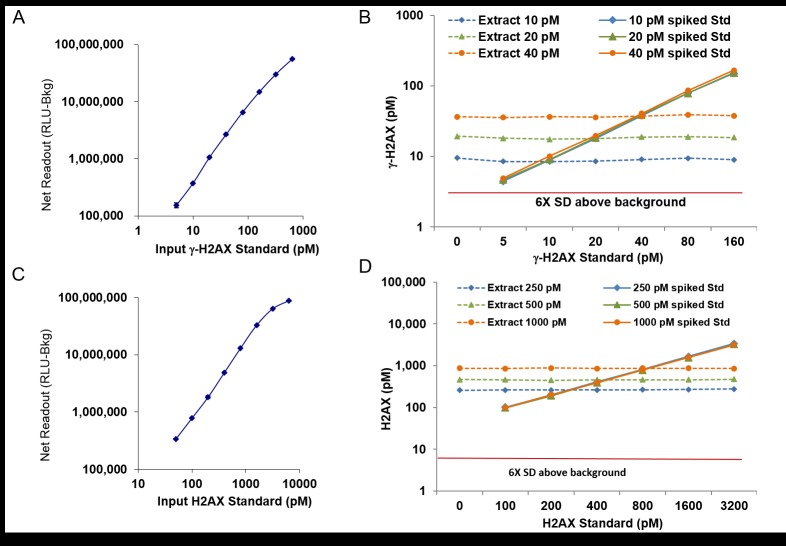
Fig 2. Consistency of standard curves for γ-H2AX and H2AX regardless of sample composition.
(A) The net readout (Relative Light Unit minus Background [RLU-Bkg]) for various concentrations (pM) of the standard γ-H2AX peptide. The background (Bkg) with zero pM standard is about 500,000 RLU. (B) γ-H2AX measurements for an extract diluted to 10 pM, 20 pM, or 40 pM γ-H2AX and then spiked with increasing amounts of the standard γ-H2AX peptide. Solid lines represent the standard curves for the spiked samples after the baseline γ-H2AX concentrations of the extract dilutions were subtracted. Dashed lines represent the readout for each dilution of the extract after the amount of peptide added to each spiked sample was subtracted. (C) The net readout (RLU-Bkg) for various concentrations (pM) of the standard H2AX protein. (D) H2AX measurements for an extract diluted to 200 pM, 500 pM, or 1000 pM H2AX and then spiked with increasing amounts of the H2AX protein. Solid lines represent the standard curves for the spiked samples after the baseline H2AX concentrations of the extract dilutions were subtracted. Dashed lines represent the readout for each dilution of the extract after the amount of peptide added to each spiked sample was subtracted. For (A-D), points represent average of 2 duplicates and error bars show standard deviation.

