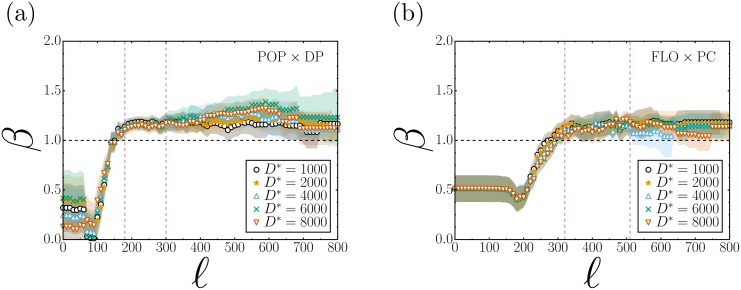
Fig 4. Behavior of exponent β by varying the parameters of the City Clustering Algorithm (CCA), ℓ and D*.
(a) The variation of β in correlation between the resident population (POP) and the disturbing the peace (DP) complaints is illustrated; (b) The variation is illustrated for correlations between the floating population (FLO) and the property crimes (PC). Both in (a) and (b), the x-axis represents ℓ, and this parameter was varied from 0 to 800 meters (m) (moment when the largest cluster consumes nearly the entire city); exponent β is shown on the y-axis. The colors of the lines represent the variation of the parameter D*, which corresponds to the resident population density in (a) and the floating population density in (b); this parameter was varied from 1000 to 8000. The shadows represent the standard error of coefficient β. It was not necessary to use values larger than 8000 because many census tracts start being discarded and the CCA can no longer form clusters. The graphs also show red dashed lines; between these lines is highlighted the range where, regardless of the parameterization, the exponent β has smaller ranges of variation. Finally, the dotted black line highlights exponent β = 1, in which the relationship between variables is isometric, in both graphs the exponent oscillates to low values of ℓ; in (a), the relationship is superlinear starting at ℓ ≥ 180 m; however in (b), superlinearity appears at ℓ ≥ 320 m (see S1 Appendix for the plots POP vs PC and FLO vs DP).

