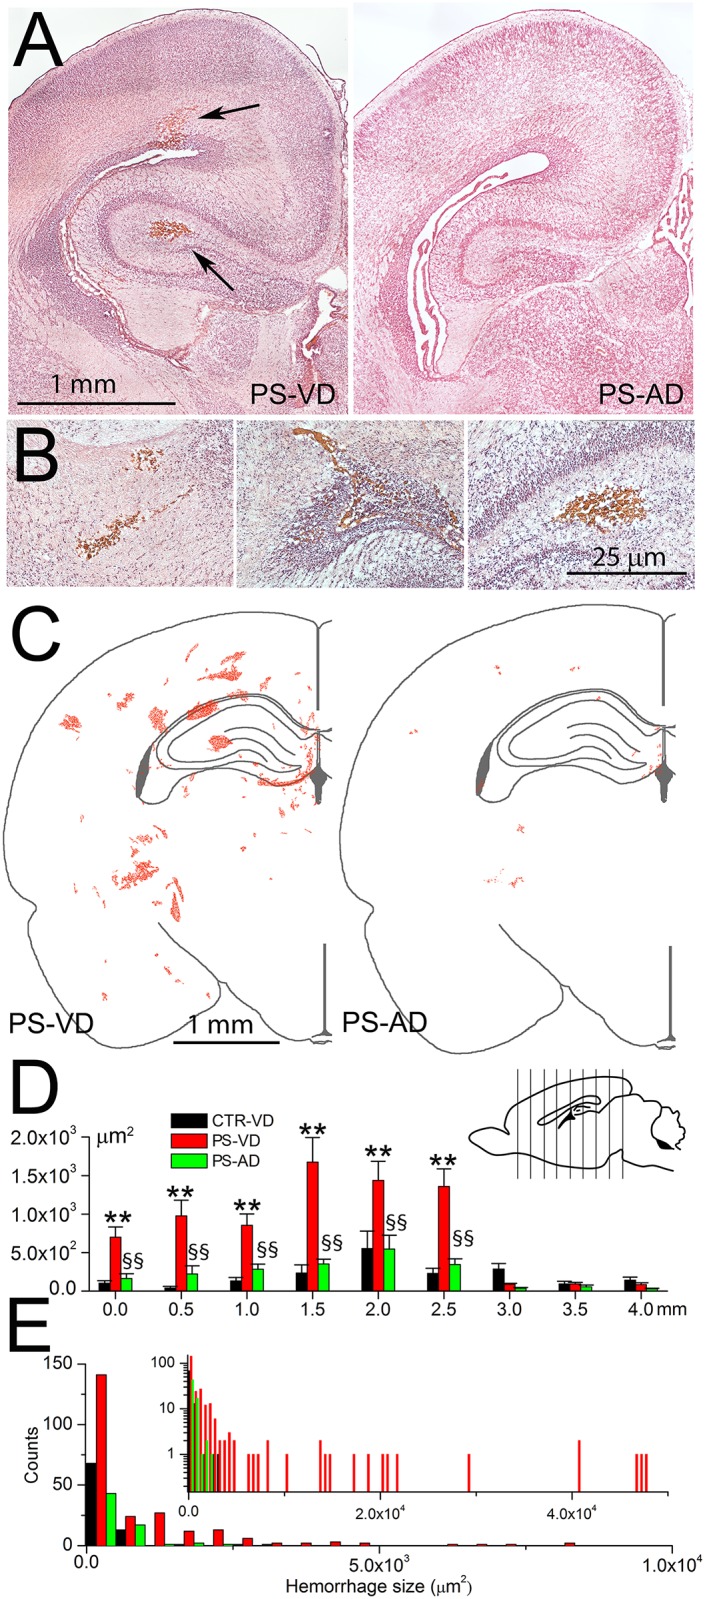
Fig 3. Cerebral microbleeds are linked to pro-angiogenic stimuli in utero followed by vaginal delivery.

A,B: H&E-stained sections of P0 brains showing representative microbleeds (arrows) in pup following prenatal pro-angiogenic stimuli with vaginal delivery (PS-VD) (A, left panel; B, all panels) but not following prenatal pro-angiogenic stimuli with abdominal delivery (PS-AD) (A, right panel); scale bars, 1 and 0.25 mm in (A) and (B), respectively. C: Maps showing the locations and sizes of microbleeds identified in the coronal section 2.5 mm from the rostral extent of the lateral ventricle, on P0 in PS-VD pups (left panel) and in PS-AD pups (right panel); data from the right and left hemispheres of 10 pups are superimposed; scale bar, 1 mm. D: Averages of the total area occupied by hemorrhages in 9 coronal sections (see inset) in CTR-VD pups, PS-VD pups, and in PS-AD pups; 10 pups per group; **, p<0.01 comparing CTR-VD and PS-VD; §§, p<0.01 comparing PS-VD and PS-AD. E: Histogram showing the frequency distribution of microbleeds by size in the 3 groups; same coronal plane as in (C); inset shows the data plotted with an extended abscissa and the ordinate in log scale.
