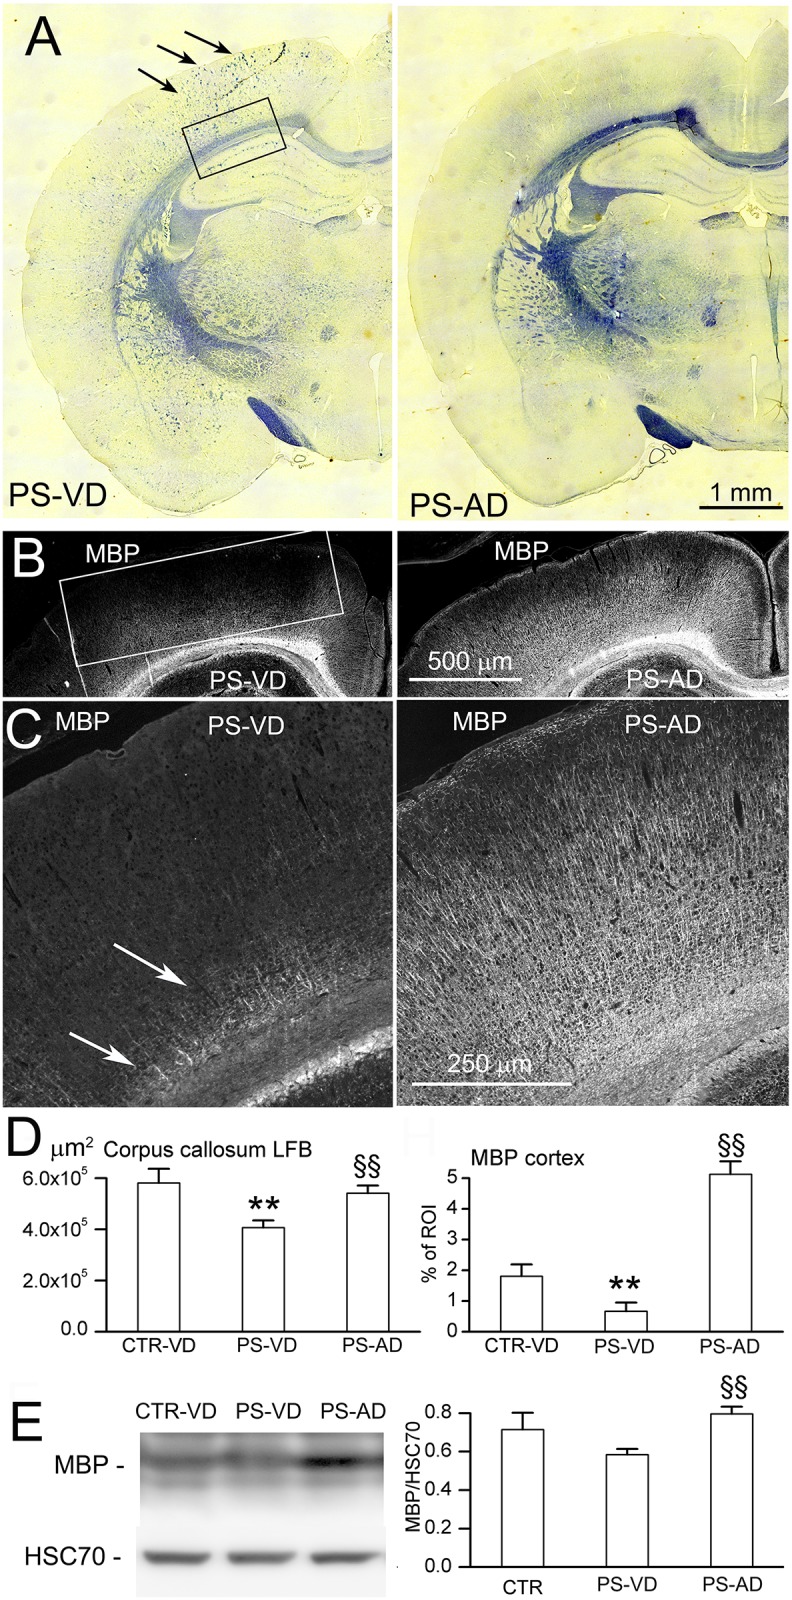
Fig 5. The effect of cerebral microbleeds on myelination.

A–D: Representative images (A–C), with quantification (D), of LFB staining (A) and MBP immunolabeling (B,C) at P52 in naïve pups with vaginal delivery (CTR-VD), pups following prenatal pro-angiogenic stimuli with vaginal delivery (PS-VD), and in pups following prenatal pro-angiogenic stimuli with abdominal delivery (PS-AD); arrows in (A) point to clumped myelinated fibers; arrows in (C) point to poorly myelinated fibers above corpus callosum; rectangles show ROI’s that were quantified; 7 rats/group; **, p<0.01 comparing CTR-VD and PS-VD; §§, p<0.01 comparing PS-VD and PS-AD; bars, 1 mm (A), 500 μm (B), 250 μm (C). E: Immunoblot (left), with quantification (right), of all bands of MBP at P52 in CTR-VD, PS-VD, and PS-AD rats; HSC70 used as loading control; 3 rats per group.
