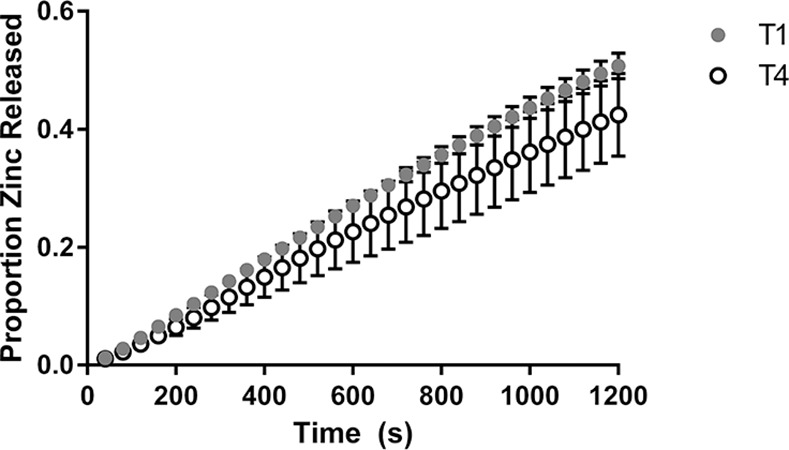
Fig 4. Release of zinc from the NSDS for Tablet Composition 1.

Values are based on a weight fraction proportion; n = 3; error bars represent standard error.

Values are based on a weight fraction proportion; n = 3; error bars represent standard error.