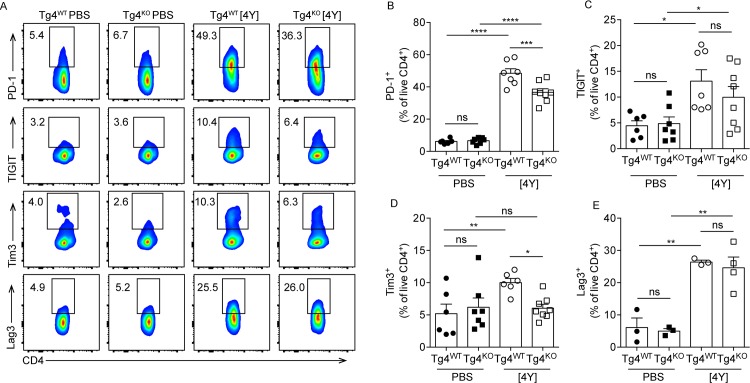
Fig 3. Tg4KO mice express lower levels of tolerance-associated surface markers following [4Y] treatment.
(A) Representative flow cytometry plots and plots of combined data (B-E) showing production of selected cell surface markers by splenic CD4+ T cells from Tg4WT and Tg4KO mice treated with [4Y] or PBS. All flow cytometry data is gated on live (viability dye-) CD4+ cells. Shown is the data from two experiments combined, with a total of 6–8 mice per group. All plots show the mean +/- SEM with each point representing data from one animal. *p<0.05, **p<0.01, ***p<0.001, ****p<0.0001, ns p>0.05 assessed by ANOVA with Tukey’s correction for multiple comparisons.

