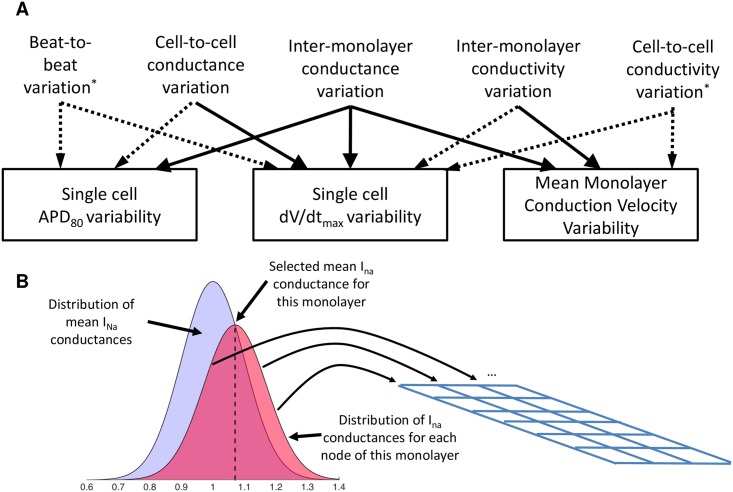
Fig 4. Modeling variability.
(A) Types of variation and their relative impacts on measured properties. Significant linkages are shown with solid lines while weak effects are shown with dashed lines. Types of variation marked with an asterisk are not described in depth but are included for completeness (B) In order to model both cell-to-cell and inter-monolayer conductance variability, a mean monolayer conductance (black dashed line) is selected from a random normal distribution (blue distribution). The conductance of each node within the monolayer is then selected from a random normal distribution around the mean monolayer conductance (red distribution)

