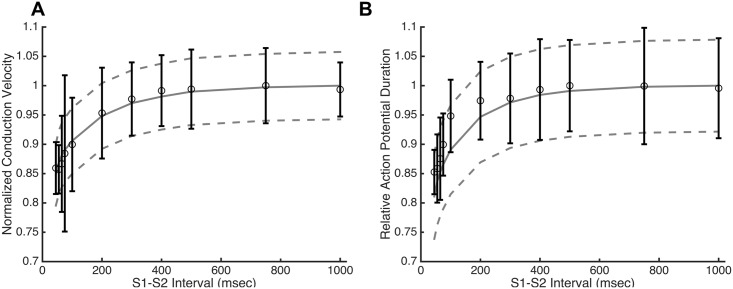
Fig 5. Ex293 restitution behavior.
The base model (solid line) is able to closely mimic the experimentally observed (open circles) conduction velocity (A) and action potential duration (B) restitution profiles (R2 = 0.97 and 0.82, respectively). Model variability (dashed lines represent +/- 1 SD) approximates the degree of experimental variability. Note that experimental data from [9] is plotted as mean ± s.d.

