
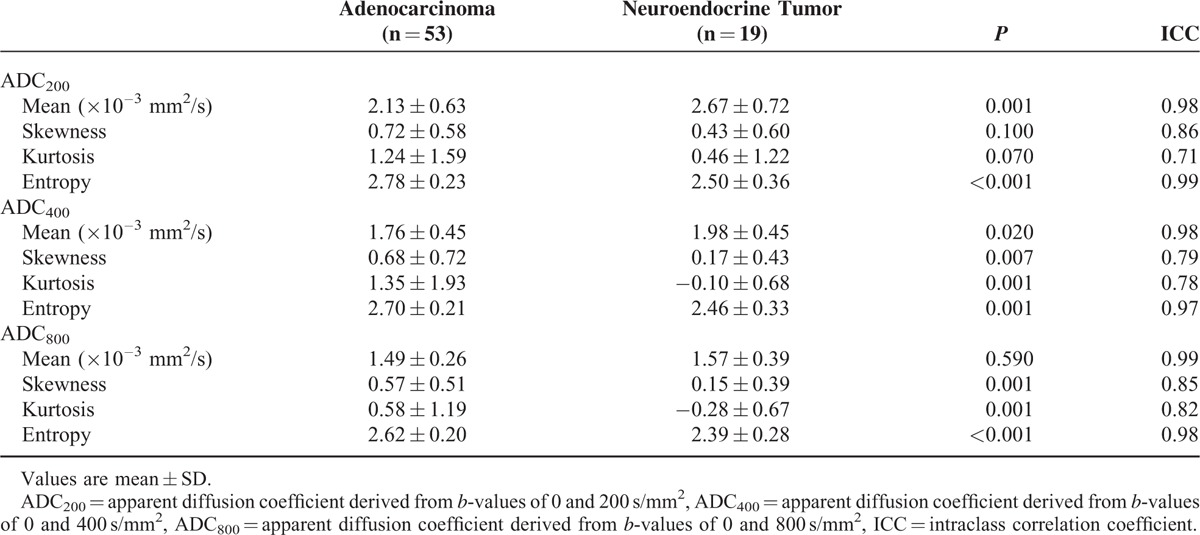
TABLE 2.
Histogram Analysis of Apparent Diffusion Coefficient Values Derived From b-Values of 0 and 200, 0 and 400, and 0 and 800 s/mm2
Official websites use .gov
A
.gov website belongs to an official
government organization in the United States.
Secure .gov websites use HTTPS
A lock (
) or https:// means you've safely
connected to the .gov website. Share sensitive
information only on official, secure websites.
Histogram Analysis of Apparent Diffusion Coefficient Values Derived From b-Values of 0 and 200, 0 and 400, and 0 and 800 s/mm2